


Summary
- The trade surplus of Australia swelled to $8.2 billion for the month of June, which is its 30th consecutive monthly trade surplus amid solid lift in exports by 3%.
- Inflation-adjusted retail sales fell 3.4% during June in volume terms, as Australian retailers are undergoing consumption drought due to lockdown in Victoria while value-based retail numbers reflected a 2.7% jump in monthly sales.
- June witnessed a persistent recovery of industries, with large monthly increase in cafes, restaurants, and takeaway food facilities, as well as clothing, footwear, and personal accessories retail.
- There were also rises in retail sales in NSW, Victoria, Western Australia, South Australia, and Tasmania in seasonally adjusted terms, apart from a fall in Northern Territory in June 2020.
As per the data released by ABS, on 4 August, Australia reported its biggest financial year trade surplus in 2019-20 on the back of rising exports, while retailers suffered the biggest plunge in the June quarter in the last 2 decades.
Let's have a look at 5 things about the trade balance and retail sales.
- The trade surplus rose 12% in June
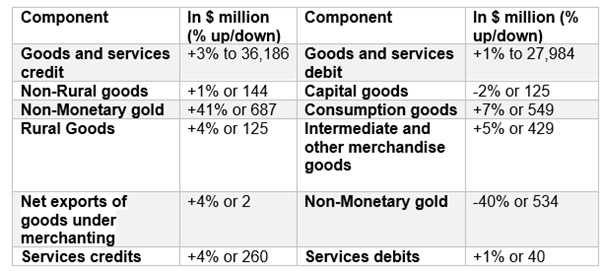
ABS data released on 4 August showed that Australia's trade surplus grew 12% to $8.2 billion, its 30th consecutive monthly trade surplus, in June 2020 in seasonally adjusted terms compared to previous month, taking the total to a massive $23.4 billion for the June quarter. The rise came amid robust growth in exports of 3% to $36,186 million.
 Source: ABS
The data reveals that amid extreme global economic disruptions triggered by COVID-19, Australia reported a record financial year trade surplus of $77.4 billion in 2019-20, with Australian exports of goods increasing by $9.29 billion or 2.5%.
- Export sector persists to boom
Exports grew 3% in June, partially boosted by dramatically growing iron ore and gold rates, giving a bonus to miner earnings and government tax receipts. Non-monetary gold surged up by 41% to $2,363 million in original and seasonally adjusted terms. Further, the largest movements were recorded in selected commodities between May and June 2020.
Iron ore fines and iron ore lumps exports to China excluding SARs and Taiwan rose 14% and 8%, with quantities up by 14%, and 6% while unit values up by 1% and 2%. Exports of iron ore to Hong Kong witnessed a drop.
Exports to China experienced a high of $14.6 billion for June, resulting in $151 billion for 12 months.
Federal Trade Minister Simon Birmingham stated that the trade data reflected the resilience and strength of the export sector of Australia amid rising export costs and disruptions to supply chains in a speech given on 4 August.
Australian exporters in sectors like agriculture, resources and advanced manufacturing still persist to survive the global economic shocks and stays extremely sought after in its key markets.
- Retail sales rose 2.7%, but outlook remains cloudy
Retailers in Australia are undergoing a consumption slump as Australia's second-biggest state of Victoria went into lockdown, which resulted in retail to bear the largest fall in the last two decades in Q2 period.
Inflation-adjusted retail sales slipped 3.4% during the June quarter, in seasonally adjusted terms, as per ABS data released on 4 August, which marked the steepest fall since the introduction of GST in 2000, surpassing expectations of a drop of 3.2%.
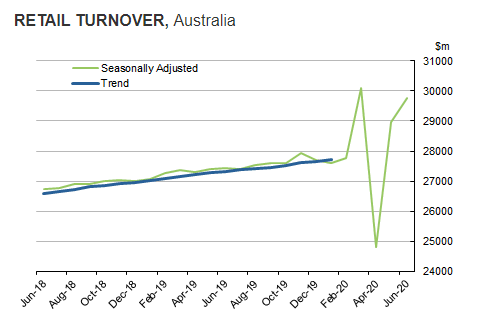
However, the fall in volumes is in sharp contradiction to value-based retail figures. Australian seasonally adjusted retail turnover rose 2.7% in June 2020, after a growth of 16.9% in May 2020 due to reopening of pubs, cafes, and shops in many parts of Australia.
Source: ABS
The larger than anticipated decline indicates consumer expenditure in the June quarter would be a burden on the GDP growth. The downturn in sales was led by losses in food retailing, cafes, restaurants, clothing, footwear, and personal accessories.
Further, online sales have stayed elevated and formed 9.7% of the total retail sales in June 2020 after adding 6.1% in June 2019.
- Recovery of industries
Industries had remained affected by trading restrictions in April and early May. However, there was a continued recovery in industries during the month of June, with large month-on-month rises in cafes, restaurants, and takeaway food facilities as well as clothing, footwear, and personal accessory retail of 27.9% and 20.5% respectively.
The seasonally adjusted estimate for food retail rose by 0.9% in June due to a growth in sales in Victoria during month-end of particularly non-discretionary items, after a rise in coronavirus cases.
By industry sub-group, the estimate increased for supermarkets and grocery stores (1.6%), and other specialised food retailing (0.6%), and dropped for Liquor retailing (-3.6%).
Though the turnover dropped in original terms for Non-perishable goods (-3.7%), Perishable goods (-3.6%) and all other products (-1.4%) in June 2020 compared to May 2020, but the retail turnover continued to be high when compared to June 2019.
Annually, the volume of perishable goods rose by 14.4%, non-perishable items by 12.4% and all other products by 7.8%. The higher revenue rates represent a continuation of more food being cooked and eaten at home due to social distancing.
While the seasonally adjusted estimate of households goods retailing fell 3.2% in June in current prices, the estimate fell 12.1% for departmental stores.
- States witnessing a rise in retail sales
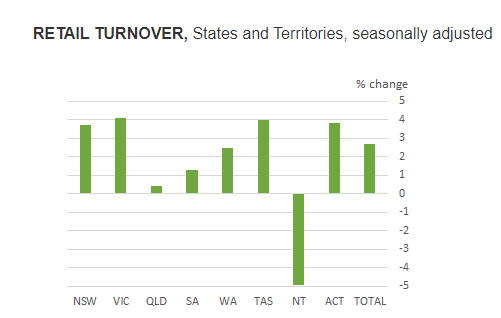
In June 2020, the following states and territories rose in seasonally adjusted terms: New South Wales at 3.7%, Victoria at 4.1%, Western Australia at 2.5%, South Australia at 1.3%, Tasmania at 4%, Queensland at 0.4% and the Australian Capital Territory at 3.8%. In June 2020, the Northern Territory plummeted in seasonally adjusted terms at -4.9%.
Source: ABS
There have been increasing warnings by experts related to the risk of the second wave of coronavirus in Victoria continuing to cloud the outlook, with weekly spending data already moderating. This week, following a persistent rise in coronavirus infections from late June, Victoria has announced a “state of crisis”.
