


We are discussing about the result updates of diversified companies which include two equipment designing companies, one veterinary services provider and a real-estate company. Letâs have a look on the yearly financial figures of these companies.
Codan Limited (ASX : CDA) is a technology company that develops, designs and manufactures equipments which are used for communications, mining solutions and for the Australian defence industry. The solutions ensure customer safety, controls, security and security support systems across the world. The company has three operating segments, namely Communications (29% of FY 19 revenues), Metal Detection (67%) and Tracking Solutions (4%).
Decent FY19 results:
FY19 Financial highlights: Recently, via a press release on 26th August 2019, CDA posted full-year FY19 results wherein, it reported sales at $270.8 m against $229.9 m in FY18 and net profit after tax at $45.7 m versus $41.5 million a year ago. CDA completed its expansion across the global military market which increased revenues by 37% year over year to $78 m in FY 19. EBITDA for the whole year stood at $ 78.6m, up 11.6% y-o-y followed by net profit before tax at $63.3 m, which grew 18.9% from the previous year.
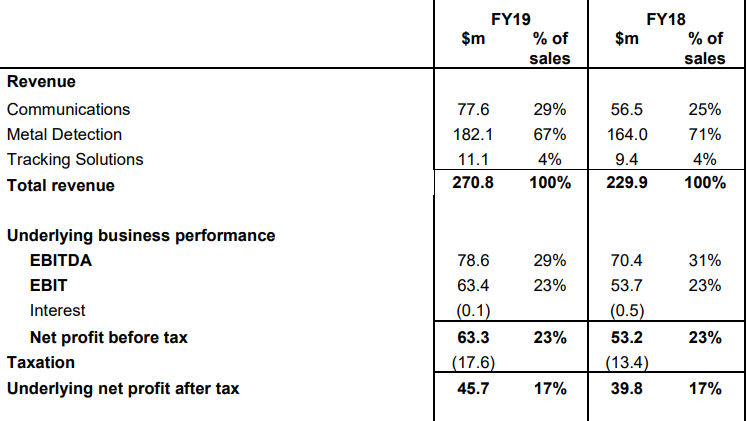
(Source: Company filing)
Dividend: The board announced a final dividend of 7.5 cents per share, fully franked (special dividend of 2.5 cents per share, a final dividend of 5.0 cents per share) against each ordinary share held. Ex-date of the dividend is on 29 August 2019, record date is 30 August 2019 and the due date of payment is on 13 September 2019.
Outlook: As per the management, FY19 turned out to be a meaningful year for the company aided by entering new markets like gold detecting in the Middle East followed by launch of EQUINOX® coin and treasure detector and increasingly diversified gold detector sales.
The management expects sales to be moderated in the first half of FY20 and due to seasonality factors, CDA expects sales to improve the second half of the year. The Board will provide further guidance at the Annual General Meeting in October.
Stock update: On AEST 12.42 26 August 2019, stock of CDA is trading at $4.490, up by 2.982% from its previous day closing. The 52-week trading range of the stock stands between $2.758- $4.540, and currently, CDA is quoting at the higher end of its 52-week trading range. The stock of CDA has generated healthy returns of 30.93% and 41.33% in the last three and six months, respectively. The market capitalisation of the stock is $781.43m while the stock is available at a P/E multiple of 16.210x. CDA has posted an annualised dividend yield of 1.95%.
National Veterinary Care Ltd
National Veterinary Care Ltd (ASX: NVL) is a leading veterinary services provider in Australia and New Zealand region. NVL has expanded its business through acquisitions at a clinic level. The companyâs portfolio consists of 99 veterinary service businesses spread across Australia and New Zealand. The company provides service like clinical care for pets, veterinary training centre for professionals, etc.
Announcement of Annual results for the year ended 30 June 2019:
NVL announced its FY19 financial results with a market update on 26 August 2019 wherein the company posted revenues of $118.4m, a growth of 43.6% from the previous year. Net profit after tax came in at $8.04m, up 28.9% from that in FY18. Underlying EBITDA for the company during the year stood at $18.0m, up 37.7% y-o-y followed by an underlying EBITDA margin at 15.4%. Cash and cash equivalents stood at $19.841 m, trade receivables and inventories at $3.363m and $4.222m, respectively as on 30 June 2019. Property, plant and equipment of the company were valued at $9,596 m while intangibles stood at $145.859 m. The company reported trade and other payables at $14.930 m while borrowings and net assets stood at $54.821 m and $98.387 m, respectively. Net cash used in investing activities during FY19 stood at $39.416 m.
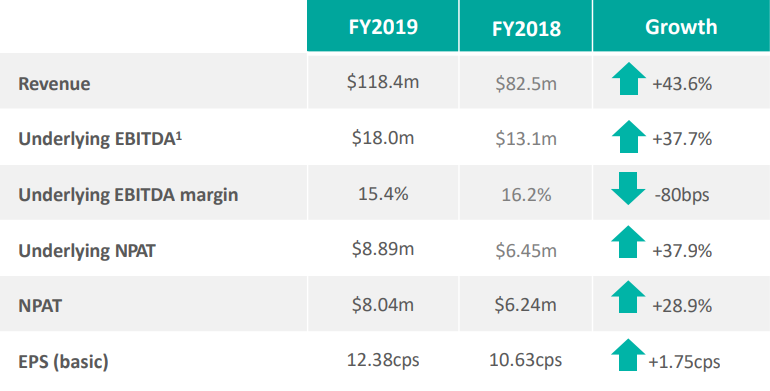
(Source: Company filing)
Dividend announcement: The company announced a dividend of 3.5 cents, fully franked against each ordinary share held. The ex-date of the dividend is on 6 September 2019 with a record date on 9th September 2019. The dividend will be paid on 2Octover 2019.
Outlook: As per management guidance, FY20 underlying revenue is expected to be more than $140 million, which translates into a growth of 20% on FY 2019 underlying revenues). Underlying EBITDA margin expected to be at 15.5-16.0% excluding the impact of AASB 16 Leases.
Stock update: On AEST 1.56pm 26 August 2019, NVL is trading at $2.490, up ~3.75% from its previous closing. The market capitalisation of the stock stood at $160.8 m along with 67m of outstanding shares. The stock is available at a P/E multiple of 26.000x with an annualised dividend yield of 1.25%. The 52-week trading range of NVL stands between $1.580- $2.560, and currently, NVL is trading at the higher end of its 52-week trading range. The stock of NVL has generated healthy returns of 18.23% and 20% in the last three-months and six- months, respectively.
McGrath Limited
McGrath Limited (ASX: MEA) is an Australia based residential real estate company and deals in integrated services. The range of services offered are agency sales, property management, mortgage broking and career training services. Currently, McGrath Estate Agents has 98 offices located across the East Coast of Australia.
MEA announced 12 months results for the ended 30 June 2019 (FY19): The company reported its FY19 financial numbers with revenues down by 17% year over year to $82.7 million and a net loss after tax of $15.6 million including one-time impairment charges of $3.4 million and $3.7 m of onerous contract provision relating to IT strategy reinvigoration. Reported EBITDA stood at ($10.1) compared to $1m in FY 18. Cash balance as on 30 June 2019 stood at $10.3 million and current liabilities at $15.7 million. Total current assets came at $32.3 million. Trade and other payables came at $13.036 million, a provision at $2.673m and net assists at $30.848 million. The company made a total investment of $4.539 million into property, plant and equipment and intangible assets during the year.
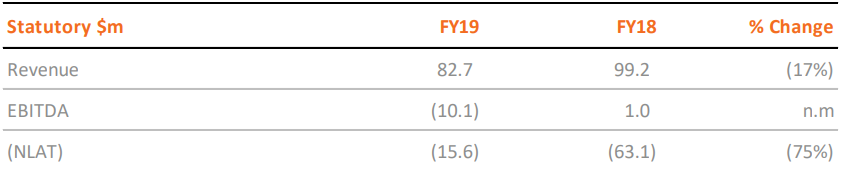
(Source: Company filing)
Outlook: The management expects stabilisation in house prices during FY20 accompanied by tight listing levels, which may result in lower transaction volumes. Recent easing in financing restrictions followed by interest rate-cut is likely to assist in the availability of credit for house borrowers. The management is confident of expanding market share through its existing brands.
Stock update: The stock is trading at $0.235, at the same level as its previous close. The Total market capitalization of the stock stood at $39.46 million accompanied by the total number of outstanding shares at 167.93 million. The 52-week trading range of MEA is in between $0.195-$0.420 and currently, the stock is trading near the lower end of its 52-week trading range. On a year-to-date basis, the MEA delivered a negative return of 18.97%.
Synertec Corporation Limited
Synertec Corporation Limited (ASX : SOP) is engaged in providing specialist engineering consultancy and compliance services across high-risk and complex industries. The company deals in incorporation of complex automated and highly instrumented systems and processes designed to improve the clientâs efficiency and safety. The client base of SOP is located across Australia and overseas while the company has its offices in Melbourne and Perth.
FY19 financial performance:
Recently, the company reported its FY19 financial and operating performance through a press-release. SOP reported revenue at A$24.1m, a 111% increase over the corresponding prior-year period, while net profit after tax came at ($0.1 m) and, improved from ($0.3 m) in FY18. EBITDA was at $0.1 million against a loss of 0.4 million in FY18.
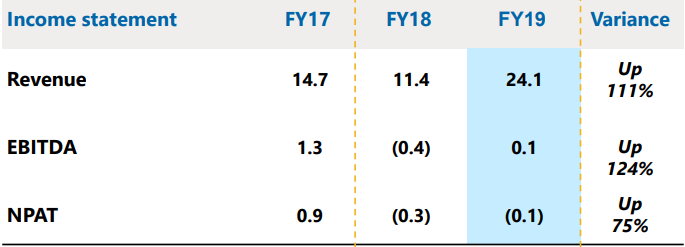
(Source: Company filing)
The company reported cash at $5.8 million, total assets at $9.8 million and total shareholdersâ equity at $5.2 million.
Stock update: SOP is trading at $0.048, up 2.128% from its previous close. The Total market capitalization of the stock stood at $10.37 million with shares outstanding at 220.7 million. The 52-week trading range SOP stood in between $0.028-$0.054 and currently, the stock is trading near the higher band of its 52-week trading range. The stock of SOP has given positive returns of 4.44% and 9.30% in the last six-months and one-year, respectively.
Disclaimer
This website is a service of Kalkine Media Pty. Ltd. A.C.N. 629 651 672. The website has been prepared for informational purposes only and is not intended to be used as a complete source of information on any particular company. Kalkine Media does not in any way endorse or recommend individuals, products or services that may be discussed on this site. Our publications are NOT a solicitation or recommendation to buy, sell or hold. We are neither licensed nor qualified to provide investment advice
