
.jpg)


Summary
- Bitcoin prices have reacted sharply over the emerging headlines of South Korean police raiding a crypto exchange with the currency falling ~ 16.22 per cent.
- South Korean police raided Bithumb over the ongoing investigation of fraud allegedly committed by one of the main shareholders of the organisation.
- The Seoul Metropolitan Police Agency’s Intelligent Crime Investigation Unit – searched and seized the headquarters of the exchange in Gangnam-gu, Seoul.
- Bitcoin demonstrated a reversal chart pattern ahead of the news.
- Bitcoin on charts.
Bitcoin prices have reacted sharply to the emerging news of South Korean police raiding a crypto exchange – Bithumb over fraud allegations.
South Korean police raided Bithumb – one of the country’s largest cryptocurrency exchange on 2 September 2020 as part of the ongoing investigation of fraud allegedly committed by one of the main shareholders of the organisation.
The market reacted sharply to the news with Bitcoin prices tumbling from USD 11,947.5 (intraday high on 2 September 2020) to the level of USD 10,009.5 (intraday low on 3 September 2020), tanking ~ 16.22 per cent in just two trading sessions.
As per local media channels and publications, the Seoul Metropolitan Police Agency’s Intelligent Crime Investigation Unit – searched and seized the headquarters of the exchange in Gangnam-gu, Seoul.
The action from the metropolitan police seems to have stemmed from the alleged investment fraud committed by one of the top shareholders of the organisation at the issuance of a native toke – BXA.
As per local media houses, investors in BXA or the native token suffered considerable losses with some media citing losses to run into millions of dollars after the exchange failed to list BXA on its platform.
The native token or BXA was allegedly sold to investors before negotiation for the sale of the exchange by the Chairman – Lee Jung-hoon with the chairman of BK Group – Kim Byung-gun; however, the acquisition failed to materialise.
Investors in BXA are now alleging that the exchange and the chairman inflicted considerable damage by not listing the token, despite the clear objective of USD 25.5 million raising, citing BXA to be listed on the exchange.
Furthermore, apart from the raid, some media houses report that the chairman of the group has been under police investigations for fraud and illegal transfer of funds overseas.
Additionally, Bithumb’s latest tiff with authorities came into the limelight after the exchange was slapped with an order to pay USD 69 million in withholding taxes in late 2019.
Ahead of this news and fraud allegations on the conduct of a cryptocurrency exchange, the digital gold has been moving in an uptrend with strong recovery.
To Know More, Do Read: Bitcoin Rally Bound For a New Peak? What Are Chartists Looking At?
Is the News Going to Shift the Market Sentiment?
Bitcoin is considered as digital gold of the modern era, and many investors across the globe regard bitcoin as a key asset of the future.
The reward for generating a new bitcoin has declined due to the recent halving day, which could now keep the supply chain of the digital asset quite oblique; and thus, is a supportive factor for the currency.
Also Read: Bitcoin Caught Between Higher Acceptance and Lower Mining Reward Since the Halving Day
However, bitcoin has a history of showing extreme moves and a sudden shift in market sentiments over headlines, and in the absence of any traditional valuation approach for bitcoin, let us take a look on charts to gauge the mood.
Bitcoin on Charts
After moving in an uptrend for a while, the currency has demonstrated a reversal pattern on a daily chart with the emergence of a head & shoulder pattern. However, the pattern has almost met its theoretically suggested target and is now showing recovery.
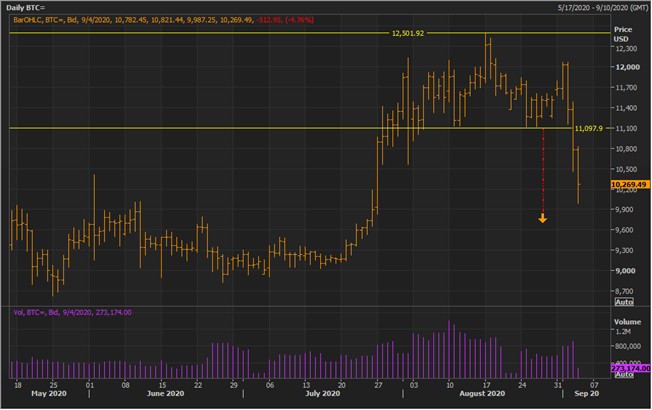
BTC Daily Chart (Source: EODHD/Others Eikon Thomson Reuters)
As could be seen from the above chart, the currency tested the neckline of the head & shoulder pattern and gave a breakdown of the same with prices now almost reaching the distance between the neckline and the high on the downside.
After reaching the theoretical target level of the head & shoulder pattern on a daily time scale, the currency is once again picking some interest in the market.
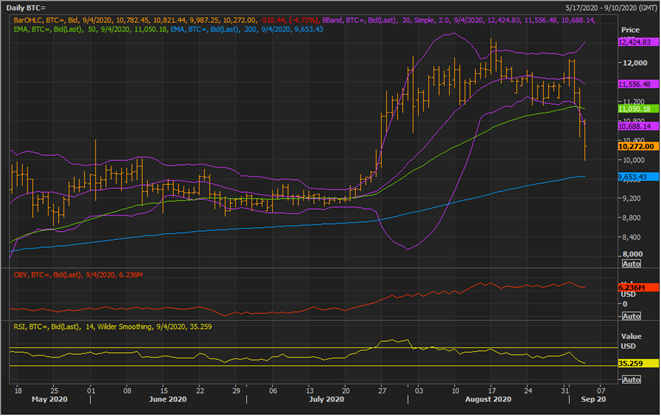
BTC Daily Chart (Source: EODHD/Others Eikon Thomson Reuters)
On further following the daily chart, it could be seen that the currency has given a volatility breakdown with prices breaching the -2 Standard Deviation of the 20-day simple Bollinger band.
- At present, the currency is trading below the 50-day exponential moving average (or EMA), reflecting upon the recent sell-off which emerged from the headlines.
- However, the currency is still trading above the 200-day EMA, which could act as immediate support for the currency.
- If the currency sustains and further confirms the volatility breakdown, it could attract bearish sentiments.
- Also, the current decline in price and the On Balance Volume is showing a divergence, which is reflecting on the accumulation on declines, which in turn, could attract bulls over the short-run.
- The 14-day Relative Strength Index (or RSI) has now reached the oversold zone, which coupled with a divergence in the price action and OBV could seed bullish sentiments ahead.
In a nutshell, the currency has reacted sharply over the recent headlines with prices falling ~ 16.22 per cent in just two sessions. However, post the news, a head & shoulder pattern unfolded on the daily chart, which has now met its theoretical target.
At present, the currency is showing some bearish price setup over the recent plunge; however, technical indicators such as OBV are showing a divergence with price action, which coupled with a recently corrected RSI could attract bulls attention over the short-run.
