


Summary
- Silver spot is gaining global traction and attracting the investing community with its impeccable total return of over 70 per cent on a six-month basis.
- Furthermore, the commodity is outperforming the return from the gold spot with a significant margin, leading to a sentiment splash in the commodity.
- After spending few trading sessions under consolidation, the silver spot is finally back in action with daily and weekly charts reflecting on strong bullish sentiments around the commodity.
Silver prices have been emerging as the darling commodity with returns even outperforming gold on a six-month basis.
The investing community on the global front is now eyeing silver over the emerging supply disruptions and robust demand for the white metal.
To Know More, Do Read: Silver Outperforms Gold with Over 30% Return; Money Managers Betting on Silver!!
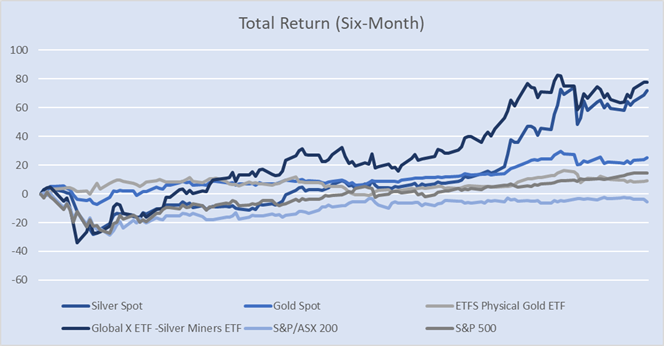
Silver Spot and Others Six-Month Total Return Comparison Chart (Data Source: EODHD/Others Eikon Thomson Reuters)
Over the last six-month, the silver spot has relatively outperformed every major asset class with an impeccable total return of 71.89 per cent.
Also Read: Silver to Reach USD 19.0 Per Ounce by Year-End- Says The Silver Institute
A strong rally in silver has further improved market sentiments around silver mining stocks across the globe with some silver miners even outperforming the silver spot. The same could be inferred by strong studying the total return delivered by the Global X Silver Miners ETFs, up 77.58 per cent, which follows the Solactive Global Silver Miners Total Return Index.
Silver on a Daily Chart
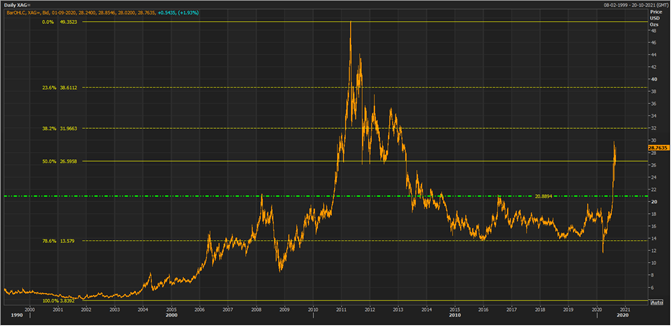
Silver Spot Daily Chart (Source: EODHD/Others Eikon Thomson Reuters)
On following the long-term daily chart of the silver spot, it could be seen that the commodity has corrected over 78.6 per cent of the previous rally before the recent momentum. As per Fibonacci retracement observations, the levels of 78.6 per cent usually attract bulls.
In the case of silver, post the correction to the level of 78.6 per cent, the silver spot picked momentum to break the horizontal resistance level at ~ USD 20.8394 and entered an intermediate uptrend. The horizontal breakout line could act as a major support for the commodity.
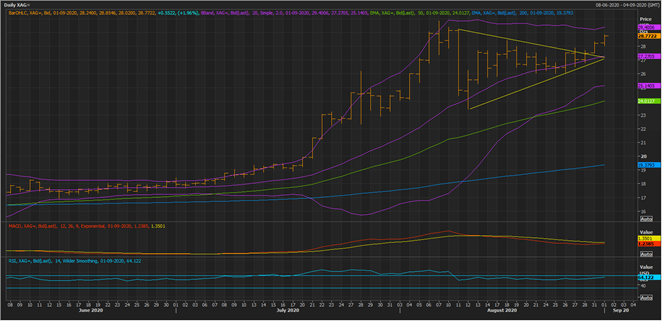
Silver Spot Daily Chart (Source: EODHD/Others Eikon Thomson Reuters)
Furthermore, in the recent past, the silver spot has given and confirmed a breakout of a symmetrical triangle formation on the daily chart, reflecting on the end of a consolidation phase, which could further seed bullish sentiments ahead.
- However, the sudden rush in silver prices has increased volatility considerably, which now requires proactive stop loss to trail with the market in any direction.
- Post a volatility jump, the silver spot is now trying to test the +2 Standard Deviation of the 20-day simple Bollinger band, which should act as a primary hurdle for the commodity.
- Likewise, the mean value of the Bollinger band, which is overlapping with the bottom line of the symmetrical triangle, could act as an immediate and decisive support for the commodity.
- As the commodity is currently trading above the pair of 50- and 200-day exponential moving average, it could be reckoned that the intermediate trend is bullish in nature, and at present, bulls are dominating the front.
- Additionally, the major and decisive support for the commodity is at the -2 Standard Deviation of the Bollinger, which is overlapping with the 50-day EMA.
- A slight correction in silver from the recent top is further getting reflected on technical analysis indicators with 12,24,9 MACD showing a negative signal (as the signal line is below the base line); however, the spread between both lines are now narrowing down and might follow the price action with a successful attempt at volatility break.
- Likewise, the 14-day Relative Strength Index (or RSI) has corrected from the overbought zone; however, is now hovering around the mean.
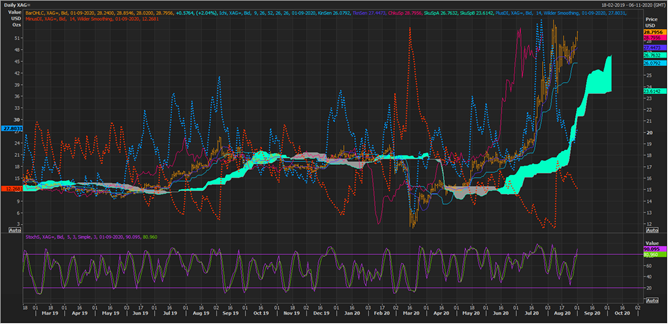
Silver Spot Daily Chart (Source: EODHD/Others Eikon Thomson Reuters)
On applying the Ichimoku Kinko Hyo on the daily chart along with some momentum-based technical signals, it could be seen that the current setup looks bullish in nature; however, with increased volatility, the risk of whiplashes are getting high, which would require close following of such momentum-based signals to gauge the market mood.
- At present, the silver spot is trading above Span A with a positive crossover between the conversion line and the base line above Span A, reflecting on the current bullish sentiment around the commodity.
- Also, Span A is trading above Span B, suggesting that the intermediate trend is silver is now bullish.
- Moreover, the spread between Span A and Span B along with the spread between the conversion line and the base line is increasing, reflecting upon the momentum in the silver spot.
- On applying directional signals on the daily chart, it could be seen that the plus DI is trading above the minus DI, which are now travelling in the opposite direction and reflecting upon the entry on bulls post a correction in prices from the top.
Silver on a Weekly Chart
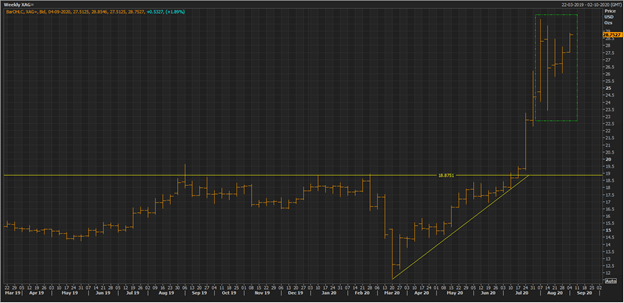
Silver Spot Weekly Chart (Source: EODHD/Others Eikon Thomson Reuters)
The present bullish setup in silver is more evident in the weekly timeframe, with the weekly bar crossing the horizontal resistance in an ascending triangle style. Post breaking above the horizontal resistance, the silver spot spiked and corrected (most probably due to profit-booking activities).
However, during the consolidation phase, the weekly chart contoured a bullish setup with the emergence of two outside bars, i.e., days of large volatile trading, followed by two inside bar and a high breach of the inside bar.
The emergence of two outside bars reflected a large exchange of the commodity and intense competition between bulls and bears, leading to heightened volatility. However, post that, the market took a breather with two weeks of consolidation (as reflected by two inside bar), and after the consolidation, the last weekly candle broke above the high of the previous inside bar, reflecting that bullish sentiments are once again taking surface.
