
 AUS
AUS
 NZ
NZ
 UK
UK
 CA
CA
 USA
USA
 IND
IND








Gold prices are again soaring in the international market with spot prices rising back after giving a false breakdown below a symmetrical triangle formation on the daily chart. The gold spot rose from the level of USD 1,691.59 (intraday low on 11 May 2020) to the present high of 1,765.38 (as on 18 May 2020), which marks a price appreciation of ~4.32 per cent and fifth consecutive rise in the spot market.
However, gold market came under sudden pressure during the evening trading session on 18 May 2020 but is now again surging to presently trade at USD 1,740.22 per ounce (as on 19 May 2020 11:58 PM AEST), up by 0.44 per cent against its previous close.
Also Read: Gold Back on The Front Foot as Powell Warns of Lasting Economic Damage
The current rally has once again taken the gold spot above the seven-year high, and the market seems to be favouring gold to further safeguard against the economic conundrum across the globe.
Previous Seven-Year High Breach: Gold Shatters 7-Year High, Joy Ride Coming For ASX-listed Gold Stocks?
The rally in the gold spot is presently being supported by an array of dismal economic figures from the United States, which is the top-most economy by consumption.
Recently, the Bureau of Labour Statistics reported a 0.8 per cent decline in the CPI index for April 2020, which remained considerably down against the previous decline of 0.4 per cent, which further points out that as suggested by the Fed Chair Jerome Powell in his recent economic speech, that the United States is currently facing a risk of recission with lower inflation, which makes the current environment unprecedented as compared to the 2008 financial crisis with high inflation and the great depression of the 1930s.
Apart from CPI, majority of other economic figures, such as Core CPI, Core PPI, and unemployment also took a material hit for April 2020, while retail sales figures plunged substantially for the same period.
As per the data from the Census Bureau, the Core Retail Sales for April plunged by 17.2 per cent against the previous reading, which remained considerably down against the previous rise of 4.0 per cent and the market consensus of 8.6 per cent.
The array of dismal economic figures boosted investor sentiment in gold once again.
At the starting of February 2020, market expectations over the global economic growth plummeted, and uncertainty increased sharply, driving down risky asset prices, and putting downward pressure on Treasury yields across the global front, which further reflected on the decrease in investor appetite for risk amid deteriorating market conditions, which in turn, propelled the gold market.
While the market behaviour was evident over risky assets amidst COVID-19 outbreak until now, the recent dismal economic figures along with the forecast of a slowdown in the global economy is pulling cards in the gold market.
In the status quo, the United States Federal Reserve suggested in its financial stability report that the property price, which typically takes more time to respond to sudden changes in economic activity, would soon come under pressure as well and asset prices would remain vulnerable to significant declines should the pandemic worsen.
How is the Bond Valuation Showing Low Confidence?
Bond yields on longer-dated Treasury securities around the globe reached to a very low level with yields on 10-year U.S. T-Bill decline to 0.31 per cent (in March 2020) from 3.261 per cent in September 2019, reflecting heightened uncertainty and realized volatility. However, until recently, yields again recovered till 1.279 per cent (high on 19 March 2020) to pull the bond valuation down, but again slipped to the present level of 0.648 per cent (as on 18 May 2020 5:21 PM AEST).
However, now a decline could be seen in the CBOE treasury market volatility index, which is a forward-looking measure derived from options prices, which previously spiked during March with average reaching to the highest level since 2008-09, and by mid-March 2020 there were indications of severe market dislocations.
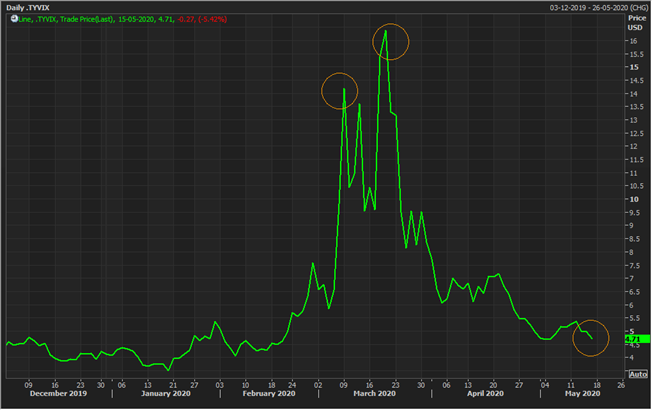
CBOE Treasury Yield Volatility Index (Source: EODHD/Others Thomson Reuters)
While the volatility across the bond market was evident during March with a spike in trading volumes, bond yields took a hit and the spread between long-dated and short-dated T-Bill narrowed, which Fed explains that could be due to constraints on dealers’ ability to expand their balance sheets to hold higher quantities of assets amid a wave of Treasury securities sales.
However, the Fed intervention in the bond spread though has somewhat returned to the nominal levels, yet the long-dated yields are in consistent pressure.
To Know More, Do Read: Home Currency To Stand Tall Against The U.S. Dollar Ahead?
The Repercussion of COVID-19 Outbreak of Households
The COVID-19 outbreak has caused a serve trauma to households across the globe, both professionally and personally, and as per the recent survey of the United States Federal Reserve (conducted from 3 April to 6 April and with a small sample size of 100 households), nearly one-fifth of adults experienced either a job loss or a reduction in their hours in March 2020 as the spread of COVID-19 intensified across the nation with about 33.33 per cent experiencing job loss or reduction in working hours.
In the sample size of a thousand, 13 per cent adults indicated that they lost a job in March 2020, and an additional 6 per cent said that they had their hours reduced or took unpaid leave.
Gold On Charts
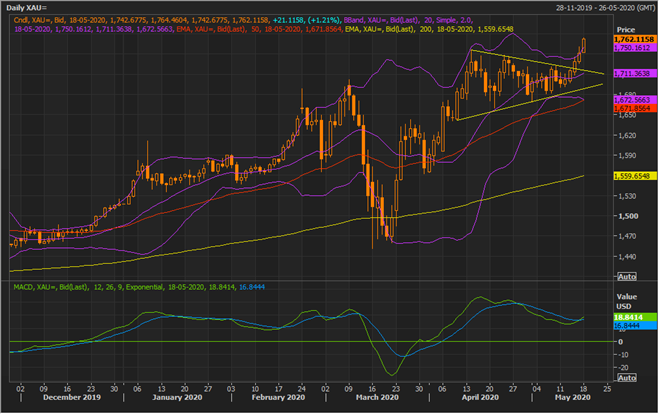
XAU Daily Chart (Source: EODHD/Others Thomson Reuters)
On the daily chart, it could be seen that the gold spot gained momentum in the status quo and breached the +1 Standard Deviation (SD) of the 20-day Bollinger band, which coupled with a positive signal from the 12,26,9 MACD suggests decent momentum and could further attract bullish sentiments to expand the +-1 SD ahead, leading to higher volatility.
However, the -1-SD (or the lower line of the Bollinger band) is showing narrow spread with the 50-day exponential moving average crossing it from below, reflecting on a Bollinger band squeeze and suggesting that gold spot is poised for a good one-sided moment ahead.
The lower end of the band or -1 SD would now serve as the support for the gold spot, followed by the 50-day EMA and at last the 200-day EMA.
