


Investment management firm, Challenger Limited (ASX: CGF) has unveiled its FY19 results today (i.e., 13th August 2019). Like many other financial services company, for Challenger Limited also, the performance during 2019 was impacted by disruption across the Australian financial services landscape.
Group Assets Under Management (AUM) for the full year was around $81.8 billion, slightly up by 1% on pcp. Likewise, the companyâs normalised NPBT was also up by 1% to $548 million, in line with the revised guidance provided in January 2019. The growth in the companyâs earnings is believed to be impacted by lower equity distributions and lower performance fees.
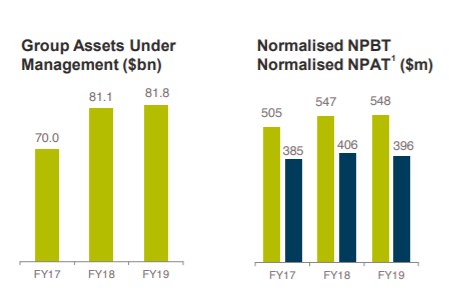
Group Assets Under Management (AUM), Normalised NPBT and Normalised NPAT for FY19 (Source: Company Reports)
For FY19, the company reported normalised cost to income ratio of 32.6% which is within the targeted range and is lower than the ratio in 2018 (32.7%), reflecting continued cost discipline throughout the business. At the end of FY19, the company had a total equity of $3.6 billion and 687 employees people on a full-time equivalent (FTE) basis.
The company has declared a final dividend of 35.5 cents per share (100% franked), unchanged from the prior year.
For FY19, the company has reported resilient business outcomes. In Life business, the companyâs domestic sales were down by 4% in FY19 despite market disruption. The Total Life sales were $4.6 billion, down by 18% on pcp, impacted by both lower annuity and lower other product sales.
The main cause behind the decline in annuity sales was lower MS Primary sales in Japan, which were down by 54% due to higher US interest rates relative to Australia. It is expected that the contribution from MS Primary will increase significantly in FY20 following an agreement with Challenger to reinsure US dollar annuities in Japan, which commenced on 1 July 2019.
The company has intensified its efforts to engage more directly with customers to build bottom-up customer demand. During the year, the company launched a new brand campaign and website to build awareness about Challenger and the benefits of annuities.
In Funds Management business, the company reported EBIT growth of 23% (excluding performance fees) in FY19. At the end of FY19, Challenger Group was strongly capitalised with $1.5 billion of excess regulatory capital and Group cash.
During the year, the company significantly expanded strategic partnership with MS&AD to include US dollar annuities. It also Expanded distribution reach with the launch of BT Panorama platform in first half of 2019, and HUB24 and Netwealth in second half of 2019.
As per Mr. Peter Polson (Independent Chair of Challenger Limited), the companyâs business is in good shape to navigate the current operating environment and well positioned to capture opportunities as they emerge. It is believed that the companyâs Investment in a range of new Distribution, Product and Marketing growth initiatives in 2020 will support deeper integration with the advice process and build bottom-up customer demand for Challenger annuities.
Following the release of FY19 results, the companyâs shares witnessed an uplift of 2.462% during the intraday trade on 13th August 2019. At market close on same day, the companyâs shares were trading at a price of $6.660 with a market capitalisation of circa 3.98 billion.
Peer Analyses
To understand more about the financial sector landscape of Australia, letâs take a look at the performances of two other financial services companies trading on Australian Exchange.
CYBG PLC (ASX:CYB)
Financial services company, CYBG PLC (ASX: CYB) recently released Q3 FY19 trading update in which it confirmed that trading in the nine months to 30 June 2019 was in line with the Boardâs expectations. The company also confirmed that it is making good progress with the Virgin Money integration programme.
Due to higher redemptions and lower new business volumes, the Mortgage book was reduced by 0.2 per cent to £60.4 billion as depicted in the figure below.
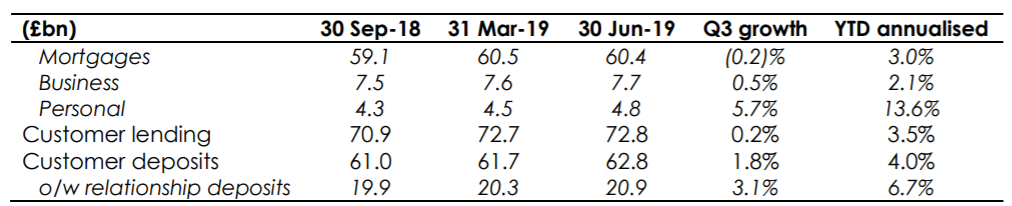
(Source: Company Reports)
The company witnesses good deposit growth of 1.8% in Q3 with its relationship deposit offerings attracting £0.6 billion in additional balances, particularly driven by strong growth in business current accounts and linked savings balances. In the fourth quarter of FY19, the company expects to recognize an estimated gain on sale of around £35 million from the disposal of c.50% of its interest in Virgin Money Unit Trust Managers Limited. As at 30 June 2019, the companyâs CET1 ratio was 14.6%.
The company has confirmed that it is on track to complete its FSMA Part VII process in October 2019 and is progressing towards its target for around £200m of net cost savings by FY 2022.
In the first half of FY19, the company reported a Pro forma underlying profit before tax of £286 million which was 5% lower than pcp. For the half year period, the company reported a total underlying income of £843 million, in line with both H1 FY18 and H2 FY18.
On the stock performance front, the companyâs stock has provided a negative return of 22.38% as on 12 August 2019. At market close on 13 August 2019, CYBâs stock was trading at a price of 2.570, down by 6.204% intraday, with a market capitalisation of circa $3.93 billion. It is to be noted that, the stock is trading at its 52 weeks low price.
Bank of Queensland Limited (ASX:BOQ)
Australia's leading regional bank, Bank of Queensland Limited (ASX: BOQ) has witnessed a decline of 8.64% in the last six months as on 12th August 2019. Like other leading banks of Australia, BOQâs H1 FY19 results were also impacted by disruption across the Australian financial services landscape. In H1 FY19, BOQ reported cash earnings after tax of $167 million in 1H FY19, down by 10 per cent on previous corresponding period.
Although BOQâs asset quality and capital position remained strong during the half year period, it has been a period of significant change for the industry, with the Final Report from the Royal Commission handed down in February 2019, leading to a significant increase in both regulatory requirements and customer expectations for all banks.
In the recent past, the bank has announced various Board and Management changes. Recently, the bank announced the retirement of Chair of the Human Resources & Remuneration Committee, David Willis (Non?Executive Director). Prior to this, the bank had announced the resignation of its CFO Matt Baxby.
BOQâs stock has an annual dividend yield of 7.92% and PE multiple of 11.380x. At market close on 13 August 2019, BOQâs stock was trading at a price of 9.040, down by 0.55% intraday, with a market capitalisation of circa $3.69 billion.
Disclaimer
This website is a service of Kalkine Media Pty. Ltd. A.C.N. 629 651 672. The website has been prepared for informational purposes only and is not intended to be used as a complete source of information on any particular company. Kalkine Media does not in any way endorse or recommend individuals, products or services that may be discussed on this site. Our publications are NOT a solicitation or recommendation to buy, sell or hold. We are neither licensed nor qualified to provide investment advice.
