


Copper prices are again under short-term pressure in the market amid weaker economic activity indication from the United States. Copper futures on COMEX tumbled from its recent top of USD 2.857 a pound (as on 26 December 2019) to USD 2.760 a pound, which underpinned a price depreciation of ~3.40 per cent.
Copper futures cracked 2.30 per cent (on 3 January 2020) against its previous close on COMEX, post the release of December 2019 U.S. ISM Manufacturing PMI (on 2 January 2019), which slipped below its mean of 50.0 to stand at 47.2, well below the market expectation of 49.0, and its previous level of 48.1.
The contraction in the manufacturing activities in the United States coupled with the increase in gold prices led the short-term plunge in copper prices; however, at present, copper futures recovered from USD 2.760 to the present level of USD 2.816 (as on 9 January 2020, 1:29 PM AEDT).
Many industry participants are expecting the short-term trend in copper to be negative, and the recently escalated tensions between the United States and Iran is further putting pressure on industrial base metals such as copper.
To Know More, Do Read: Copper- An Emerging Gold for ASX Copper Stocks; Long-dated Spreads in Contango
In the status quo, the United States killed an Iranian general (Qassem Soleimani) last week, and in response, Iran attacked the American forces in Iraq. The United States President Donald Trump had issued a warning to Iran, post killing the Iranian general that if Iran retaliates, there would be dire consequences.
Despite the warning, Iran retaliated by launching ballistic missiles on two Iraqi military bases, that were holding the personnel from the United States- as reported by the United States military.
While the geopolitical tensions exist at the marketplace, copper seems to be standing bearing the pressure with a slight correction amid supply shortage in Chilean production.
Copper Production Slumps in Chile
The Chile State Copper agency, Cochilco, informed that the copper production decreased in Chile amid weaker output from the state miner-Codelco and Australian giant- BHP Group Limited (ASX: BHP). Cochilco notified in a press release, that copper output at Codelco, the world’s largest copper miner slipped by 11 per cent in November 2019 against the previous corresponding period to stand at 155,200 tonnes, while the production at BHP’s Escondida mine in Chile declined by 1.5 per cent for the same month to stand at 103,200 tonnes.
While the reason for the decline in production is many, such as frequent strikes in Chile, maintenance across individual mines, copper took its support from the plunge in Chilean production.
The recent news of the resignation of chief commercial officer - Roberto Ecclefield from Codelco also played its role in strengthening the copper prices despite the tension between the United States and Iran.
Copper-to-Gold Ratio and Spreads
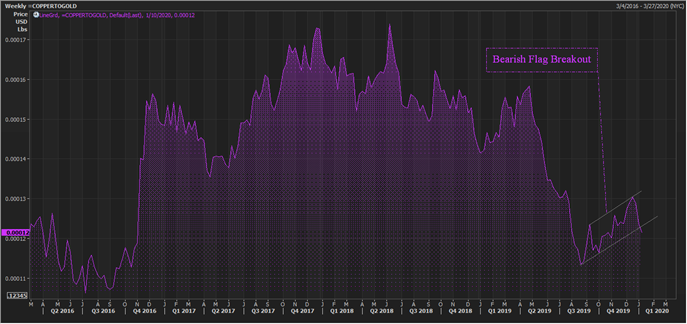
Copper-to-gold Ratio (Source: Thomson Reuters)
On following the copper-to-gold weekly chart, it could be seen that the ratio is testing the support of the potential bearish flag pattern, and if the prices break below this range and further confirms the flag it would be negative for copper and positive for gold.
The ratio generally assumes that copper and gold prices exhibit negative correlations, which holds true in general, but gold and copper do have a back-dated history is moving in the same direction, which suggests while the relationship between copper and gold holds true in general scenario it is not always mandatory, and it depends upon the prevailing economic factors.
To Know More About the Gold Rally, Do Read: Get Ready to Pay ~2.8k for 24k Gold; Gold Bulls Break the Gated Cage
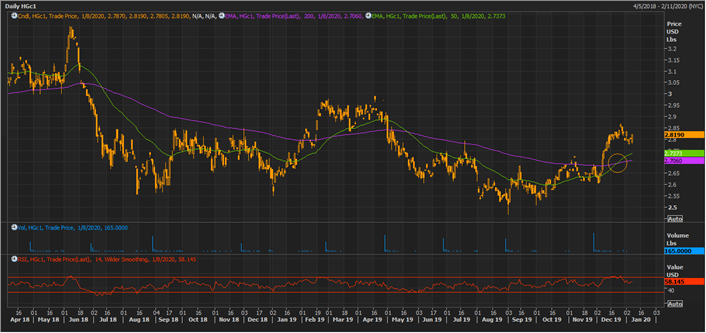
HG Daily Chart (Source: Thomson Reuters)
On the daily chart, COMEX copper futures (Jan 2020) is trading with a positive crossover between 200-day and 50-day exponential moving averages (EMAs). The pair of 200- and 50- day EMAs could be used to gauge the strength of a trend, and the price pattern history suggests that the crossover between pair of 200- and 50-days EMAs could be a reliable indicator for reckoning the future trend.
The 14-day Relative Strength Index is currently above the mean of 50.0 and is in sync with the direction of moving averages, which suggests that copper could carry its lustre ahead.
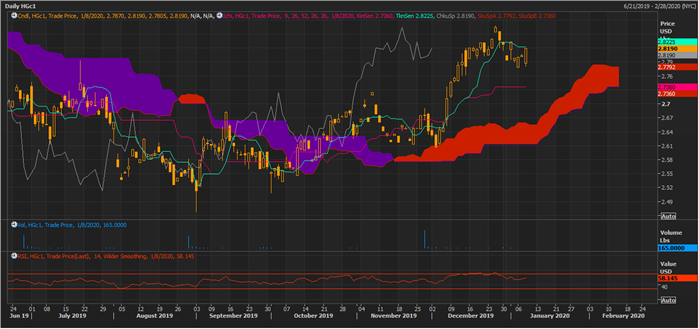
HG Daily Chart (Source: Thomson Reuters)
On applying the Ichimoku clouding technique on the daily chart, it could be observed that the spread between Span A (mean value of the conversion line and the base line) and Span B (mean of 52-period high and low) is increasing, which further reflects that the uptrend is gaining momentum in the market.
The Span A is trailing above Span B with a positive crossover between the conversion line (mean between 9-period high and low) (green line) and the base line (mean between 26-period high and low) (pink line), which coupled with an above mean 14-period RSI is a strong signal, suggesting the bulls are currently gaining momentum.
In case, the bear dominates the market amid geopolitical events or any other reason, the pink cloud area could act as support, and a bounce back or a break below the pink cloud area could further decide the price action- in case if prices correct ahead.
Key Takeaways
- Copper prices are under short-term pressure in the market, albeit, copper is still supportive by many factors and is managing to trade in positive territory.
- S. ISM Manufacturing PMI (December 2019) slipped below its mean of 50.0 to stand at 47.2.
- The United States terminated an Iranian general (Qassem Soleimani) last week, and in response, Iran attacked the American forces in Iraq, which created a geopolitical scenario, and copper reacted promptly to correct from its recent top.
- The Chile State Copper agency, Cochilco, announces that the copper production decreased in Chile amid weaker output from the state miner-Codelco and Australian giant- BHP Group Limited (ASX:BHP).
- The recent news of the resignation of chief commercial officer - Roberto Ecclefield from Codelco also played its role in strengthening the copper prices.
- On following the copper-to-gold weekly chart, it could be seen that the ratio is testing the support of the potential bearish flag pattern.
Disclaimer
This website is a service of Kalkine Media Pty. Ltd. A.C.N. 629 651 672. The website has been prepared for informational purposes only and is not intended to be used as a complete source of information on any particular company. Kalkine Media does not in any way endorse or recommend individuals, products or services that may be discussed on this site. Our publications are NOT a solicitation or recommendation to buy, sell or hold. We are neither licensed nor qualified to provide investment advice.
