


Summary
- The travel and logistic stocks are capturing the attention of the investing community as the travel and logistic restrictions across the globe ease.
- Many of the travel and transportation stocks such as Auckland International Airport Limited (ASX:AIA), Aurizon Holdings Limited (ASX:AZJ), and Brambles Limited (ASX:BXB), are showing strong price recovery with decent performance on a QTD basis.
The ease in the global lockdown is now somewhat turning the investors’ attention to the travel and related services stocks such as the one associated with transportation. Furthermore, as the global commuting have started to witness slight ease in the travel restriction and more footfall, it is also supporting the price of ASX-listed airlines stocks.
To Know More, Do Read: Airlines Under Sentiment Splash, Stocks Double from Recent lows- QAN, WEB, and FLT
In the status quo, travel and logistic related stocks are showing a strong upswing while delivering recent price gain.
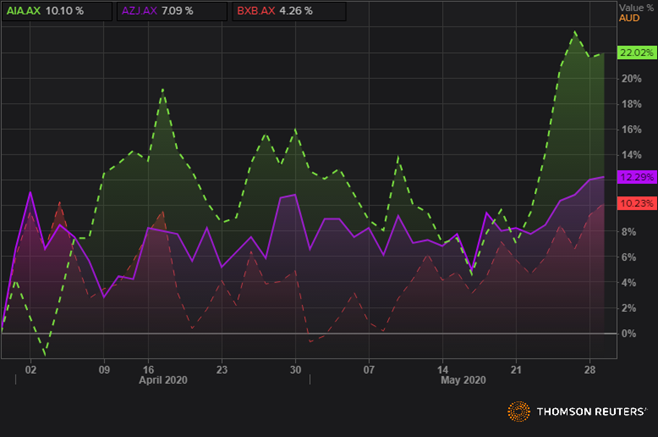
AIA, AZJ, and BXB QTD Returns (Source: Refinitiv Eikon Thomson Reuters)
ASX- Travel and Services Stock Under Momentum
- Auckland International Airport Limited (ASX:AIA)
In the status quo, the stock is under-recovery from the level of $4.26 (intraday low 23 March 2020) to the present high of $6.70 (intraday high on 28 May 2020), which marks a price recovery of ~ 57.27 per cent.
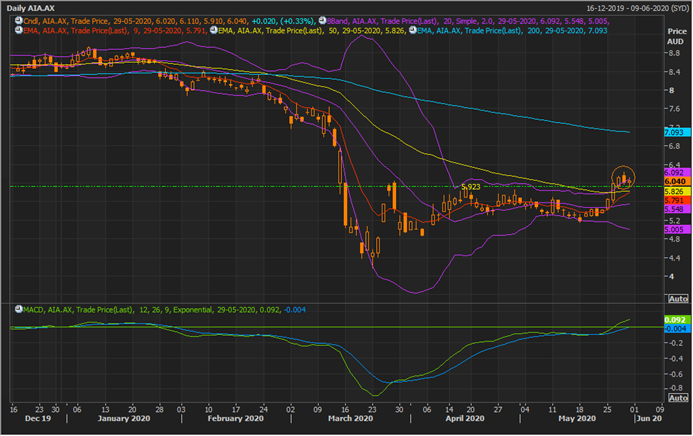
AIA Daily Chart (Source: Refinitiv Eikon Thomson Reuters)
On the daily chart, the stock has recently given a breakout above the horizontal resistance line and has also given a volatility breakout; however bulls are finding it difficult to sustain the breakout and the stock ended the trading session with a Doji candle formation on 29 May 2020, which is further pointing towards undecisive sentiment on the daily scale post a breakout.
However, the short-term 9-day exponential moving average (or EMA) is currently below the medium-term EMA of 50-day and is now moving up in the wake of price recovery, which is reflecting on bullish sentiments in the status quo.
While the stock is still trading below the 200-day EMA, the 12,16,9 MACD is giving a positive signal, and the primary resistance for the price would be 200-day EMA. If the price corrects, the immediate support is at $5.90, followed by, the mean value of the 20-day simple Bollinger band and -1 Standard Deviation (SD).
- Aurizon Holdings Limited (ASX:AZJ)
AZJ is presently under an upswing, which has now entered a phase of consolidation, and the stock has recovered from its recent low of $3.380 (intraday low on 23 March 2020) to its present high of $4.860 (intraday high on 28 May 2020), which marks a price appreciation of ~ 43.78 per cent.

AZJ Daily Chart (Source: Refinitiv Eikon Thomson Reuters)
On the daily chart, it could be seen that the stock attempted a breakout above the triangle formation on 28 May 2020; however, failed and retraced back, but the prevailing sentiments soon supported the price, and the stock ended the trading session on a positive note.
Furthermore, while giving a breakout above the triangle, the stock demonstrated a volatility breakout, reflecting bullish sentiments. In the status quo, AZJ is testing its support at the mean value of the 20-day simple Bollinger band, which is also overlapping with the 50-day EMA, suggesting that the current support is immediate and decisive support, and investors should monitor the stock closely as a breakout above the triangle with decent volume would further fan bullish sentiments.
Likewise, a failure to do so would seed bullish sentiments, which would prevail below the primary support of the bottom line of the triangle. The immediate support for the stock is at the mean value of the Bollinger band, followed by, the -1 SD, and ultimately the bottom line of the triangle pattern.
- Brambles Limited (ASX:BXB)
BXB has gained momentum on the exchange from the level of $8.970 (intraday low on 19 March 2020) to the present high of $11.705 (as on 29 May 2020), which underpin a price gain of ~ 30.49 per cent.
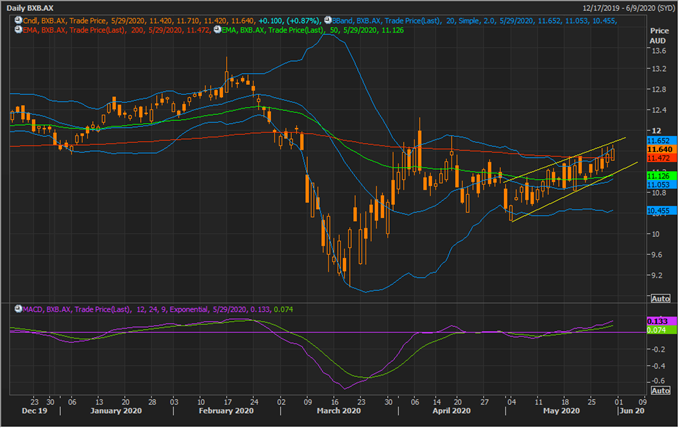
BXB Daily Chart (Source: Refinitiv Eikon Thomson Reuters)
On the daily chart, it could be seen that the stock is currently trading in an upward tilted price channel, which further reflects on bullish sentiments, but not very strong. However, the stock has just given a volatility breakout and has crossed the 200-day EMA, which could now further seed bullish sentiments. Furthermore, the 20-day simple moving average (or the mean value of the Bollinger band) is presently below the 50-day EMA with a very narrow spread, suggesting that few consecutive bull sessions could fuel the market participation ahead.
The 12,26,9 MACD is giving a positive signal, and the immediate resistance for the stock is at the upper line of the price channel. Investors should closely monitor the stock around current levels, as a break and sustain above the upper line of the price channel with decent volume could support the stock ahead, while failure to do so could prompt the stock to retest the lower line of the price channel.
The immediate support for the stock is at the mean value of the 20-day simple Bollinger band and 50-day EMA and at last at the bottom line of the price channel, followed by the -1 SD.
