


Gold prices are back in momentum with gold spot rising from USD 1,547.55 (low for the week ended 7 February 2020) to the present high of USD 1,578.20 (intraday high on 13 February 2020), which underpinned a price appreciation of ~ 1.98 per cent. While the underlying commodity or the price deriver for ASX gold stocks are on a surge, few of the ASX listed gold stocks are witnessing brief discounting amid recent performance announcement, whilst some are performing relatively bold and are on a surge.
Also Read: Tale of Two Legacy Assets, Gold Near Highs, Crude Near Lows; What are Chartists Looking at?
What to Expect Ahead?
Northern Star Resources Limited (ASX:NST)
Post reporting an increase of 54 per cent in net profit against the previous corresponding period and an EBITDA of $322.2 million, which remained 45 per cent up against pcp, the stock is on a surge on ASX, and currently moving closer to its all-time high of $14.050 (made in July 2019).
Also Read: Half Yearly Bells Ring for Beach Energy and Northern Star
NST last traded at $13.580 (as on 14 February 2020); however, the hurdle of USD 1,600 in gold is seeming to be keeping the lid on the stock as well, and for now, the stock is somewhat struggling to surpass its all-time high and immediate hurdle at $13.950- $14.00.
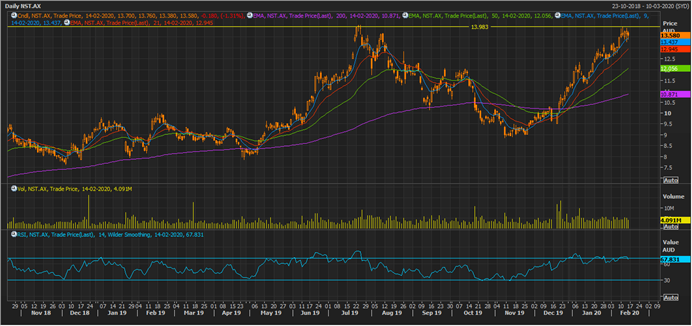
NST Daily Chart (Source: Thomson Reuters)
On the daily chart, the immediate support is intact at $13.950-$14.00, and the stock is trading well above the pair of short-term (9 & 21 days) and long-term (50 and 100 days) exponential moving averages with a positive crossover between them, which suggests that bulls remain in strength; however, there is a slight decline in volumes with 14-day Relative Strength Index hovering in the overbought zone.
Investors should keep a close eye around these developments with a keen eye on the resistance level to reckon the price direction ahead.
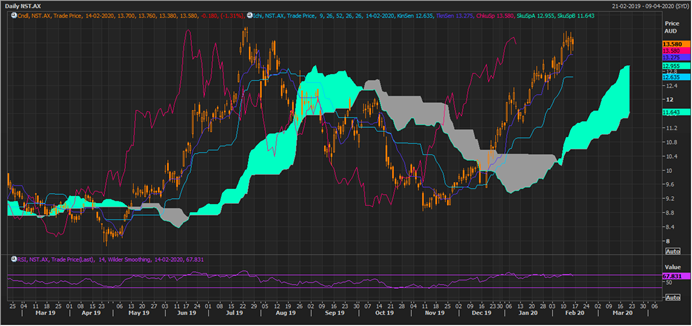
NST Daily Chart (Source: Thomson Reuters)
On applying the Ichimoku clouding technique on the daily chart, it could be seen that the stock is above Span A (mean value of the conversion line and the base line) with a positive crossover between the conversion line and the base line, which represents the mean value of 9-day and 26-day highs and lows, respectively.
The whole setup suggests that the prevailing sentiment over the stock is bullish, which could be further confirmed with the increase in the spread between Span A and Span B (mean value of 56-day high and low). However, as suggested above the 14-day RSI is in the overbought zone, which could again mark a slight correction. The sky blue cloud would be the support zone ahead.
Newcrest Mining Limited (ASX:NCM)
While the peer stock NST is on a bull run, NCM is relatively under pressure on ASX with prices falling from its recent high of $32.730 (intraday high on 28 January 2020) to the present low of $27.965 (intraday low on 14 February 2020), a price fall of nearly 14.55 per cent.
NCM recently announced the half-yearly result; however, the decline in free cash flow amid the acquisition of 70 per cent stake in Red Chris gold mine, seems to be contributing to the price fall further.
To Know More, Do Read: Free Cashflow Declines For Newcrest Post Red Chris Stake; West African Expects Early Gold Pour
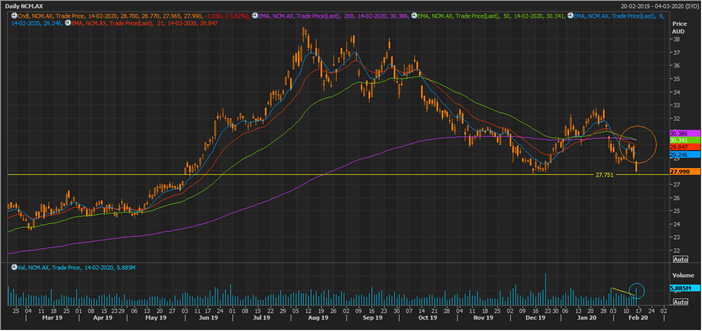
NCM Daily Chart (Source: Thomson Reuters)
On the daily chart, the stock is just above the crucial support level of $27.750- 27.700. However, the recent sell-off in the stock is with a spike in volume, which, coupled with the negative crossovers between the long-term and short-term EMAs, suggests that the bearish trend is prevailing in the stock. The stock is also trading below the 9 & 21-day EMA pair, and 50 & 100-day EMA pair, and the discussed EMAs could now be the primary resistance for the price.
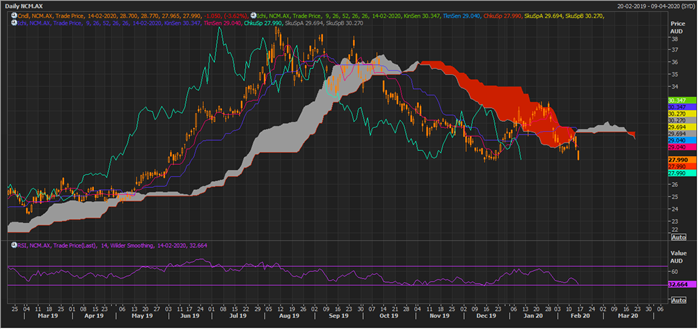
NCM Daily Chart (Source: Thomson Reuters)
On applying the Ichimoku on the daily timeframe, we can notice that the stock has slipped below Span A, and it is now below Span B, reflecting the onset of a downtrend; however, the support still needs to be broken (on a closing basis) to further confirm the downside movement ahead.
The conversion line and the base line is showing a negative crossover; however, the spread between Span A and Span B is yet small, and the price is not at the right zone or giving mixed signal to confirm any trend for future.
Evolution Mining Limited (ASX:EVN)
EVN is on a surge with price recovering from $3.44 (intraday low on 10 February 2020) to the present high of $4.24 (intraday high on 14 February 2020).
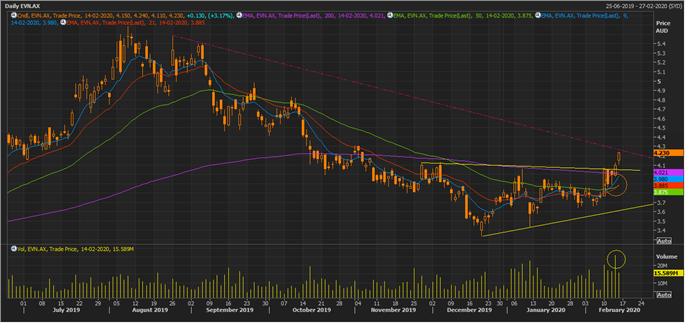
EVN Daily Chart (Source: Thomson Reuters)
On the daily chart, the stock is at a very interesting point, as post breaking out of a triangle pattern, the stock is now testing its medium-term resistance level (pink line). However, the more interesting observation is the sudden spike in volume during the breakout, which in trading context either could define sudden interest.
The volume seems supportive for the price, and it would be worth looking if the sudden rise in buying interest persists.
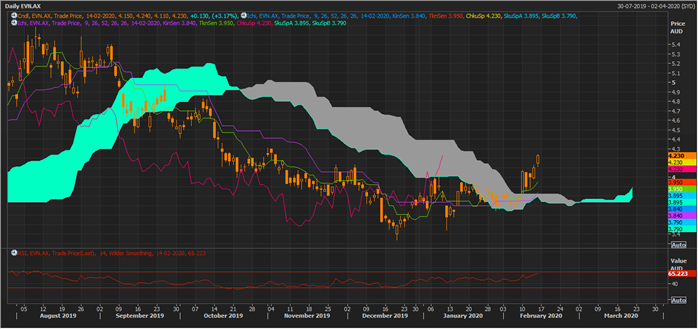
On Ichimoku cloud, it can be noticed that the stock is trading above Span A with a positive crossover between the conversion line and the base line, which further suggests that the bulls are in control; however, the spread between Span A and Span B is still small, and investors should closely monitor the stock around the resistance level, as a break above and failure to do so would decide further trend.
Also Read: Analogy of Gold Price and Gold Stocks - RMS, SAR, EVN, TBR
