


Gold prices are well on track to reach the projected price suggested by the bullish flag pattern on the weekly chart. The Australia dollar-denominated gold spot is on a surge from $2,224.64 (intraday low on 14 January 2020) to the present high of $2,345.92 (intraday high on 28 January 2020), which is near to its peak high of $2,352.26 (made on 8 January 2020).
To Know More, Do Read: Get Ready to Pay ~2.8k for 24k Gold; Gold Bulls Break the Gated Cage
After a steep rally, which started at the beginning of the year, gold prices halted for a while in the wake of record highs equity market indices; however, market remained apprehensive over risky assets and kept the bond value high despite strong performance of risky assets, which at the current moment seems to have payed-off with equity indices falling and gold prices increasing to test the peak high.
To Know More, Do Read: Equity Gains Cap Gold Shine; Market Apprehensive Over Risky Assets
In the status quo, the increasing epidemic threat of coronavirus is also exerting a lot of pressure on risky assets, with a major drag in oil prices, which is already under pressure over higher production estimations from non-OPEC countries such as the United States.
While risky assets are on a plunge, the market pessimism over the possible slowdown across the global economic front, especially China, where the virus has caused over 80 casualties and witnessed over ~3,000 registered infected cases, is further propelling gold prices.
Reassessing the Gold Trend
Gold on a Weekly Chart
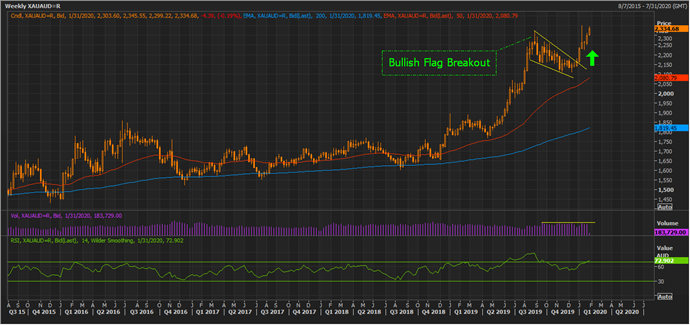
Australian Dollar-Denominated Gold Spot Weekly Chart (Source: Thomson Reuters)
On the weekly chart, gold prices had given a breakout from a bullish flag pattern and are now moving in an uptrend with price trading above 200- and 50-days exponential moving averages, which are at $1,819.45 and $2,080.79, respectively.
While gold prices are surging, the volumes are steady, which further suggests that bulls are still in control; however, now the 14-week Relative Strength Index has reached the overbought zone and is currently at 72.90, which further as per academics suggests that there could be another short-term correction ahead. However, practitioners do not agree to this rule blindly, as in a bull trend 30 to 70 range of RSI might not capture true oversold and overbought zone, respectively.
Positive indications from the weekly chart are as below:
- Bullish flag breakout.
- Steady volume.
- Prices above medium-term and long-term exponential moving averages.
Negative indications from the weekly chart are as below:
- 14-week Relative Strength index is in the overbought zone.
Gold on a Daily Chart
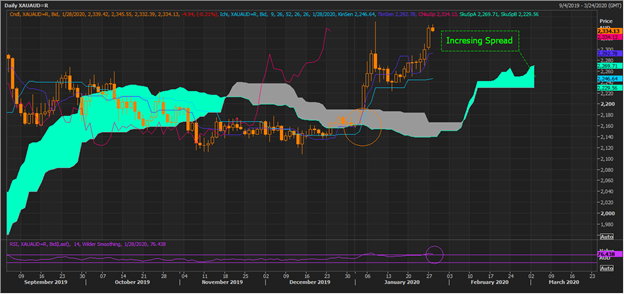
Australian Dollar-Denominated Gold Spot Daily Chart (Source: Thomson Reuters)
On the daily chart, the prices are trading above the mean of the conversion line and the base line (Span A), which is at $2,269.71. The spread between Span A and Span B (mean value of 52-day high and low) is increasing, which suggests that uptrend is gaining momentum.
The prices are also supported by a positive cross between the conversion line, which is the mean value of 9-day high and low (navy blue) and the base line, which is the mean value of 26-day high and low. The crossover between both the indicating lines took place above Span A, which is a strong indication of an uptrend.
However, the 14-day RSI is hovering in the overbought zone, which could lead towards a short-term retracement, and if prices retrace, the light blue cloud would be the support zone.
Positive indications from the daily chart are as below:
- The spread between Span A and Span B is enlarging.
- Prices are trading above Span A.
- A positive crossover between Span A and Span B could be seen.
Negative indications from the daily chart are as below:
- 14-day Relative Strength Index is in the overbought zone.
Technical Purview Over Crude Oil
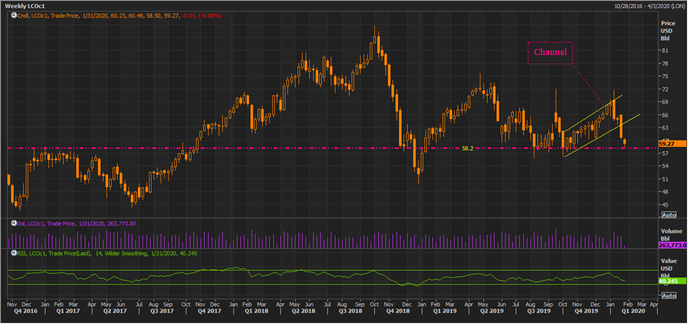
Crude oil weekly Chart (Source: Thomson Reuters)
On the weekly chart, crude oil prices have slipped below an upward trending channel; however, prices are now near the crucial support level of USD 58.2 a barrel. If crude oil sustains above the support of USD 58.2, it could move ahead to retest the breakdown level near USD 63 to 65. The prices sustaining above USD 58 with decent volume or failure to do so would decide further price actions on the weekly chart.
The volume trend has shown an increase while prices traded lower, which further suggests that presently negative sentiments prevail in crude oil. However, while crude oil prices are near its pivotal support of USD 58 a barrel, the 14-day RSI is near the oversold zone, which could give oil prices a short-term recovery.
Negative indications from the weekly chart are as below:
- The upward channel breakdown.
- Increasing volume in a downturn.
Positive indications from the weekly chart are as below:
- 14-day RSI near the oversold zone, while prices are above the crucial support level.

Crude oil Daily Chart (Source: Thomson Reuters)
On the daily chart, crude oil is trading below Span B with a negative crossover between the conversion line and the base line, which further suggests that bears are having an upper hand as of now. The spread between Span B and Span A is also enlarging, which reflects that downtrend in the primary trend over the short-run or daily timeframe.
However, just like the weekly chart, the 14-day RSI is near the oversold zone, while prices are taking support on the weekly chart, which might or might not rebound, depending upon the underlying fundamentals.
If crude oil prices recover in the market, Span B would be the resistance zone, and further trend would be defined by the price action once it breaks or fails to cross the Span B.
Energy market participants should monitor, the support zone closely along with the OPEC’s stance to support the oil price.
In the status quo, OPEC members urged cautions and mentioned that the market should not get overly pessimistic over the impact of the coronavirus on the global oil demand, as the previously similar epidemic of SARS in 2003 impacted the oil demand slightly.
To Know More, Do Read: Market Pessimism Grows Stronger Over Coronavirus; Risky Assets Under Pressure, Gold Near Record Peak
The OPEC+ members are also drafting plans to deepen the production cut, which is already at 1.7 million barrels per day. In the recent official statement, OPEC mentioned that it would further decrease the production if demand in China takes a hit amid the epidemic threat of the coronavirus.
Technical Purview Over Iron Ore

Iron Ore Daily Chart (Source: Thomson Reuters)
The new year holidays session coupled with higher infrastructure development in China supported the demand for iron ore, and while the demand remained strong, the supply concerns over tropical cyclone Blake further propelled the prices.
To Know More, Do Read: Iron Ore Gushes as Tropical Cyclone-Blake Raises Supply Concerns
The recent concerns over the coronavirus is exerting pressure on iron ore prices, and on the daily chart the commodity is slightly retracing; however, on the daily chart, iron ore prices are trading above Span A with large spread between the Span A and Span B, which suggests that the primary trend is an uptrend.
The fall in iron ore prices is now putting pressure on iron ore mining companies such as Fortescue Metals Group Limited (ASX:FMG), which previously moved near its all-time high peak, and made Andrew Forrest the top contender of Australia’s richest.
Also Read: Andrew Forrest-Iron Ore Magnet Racing towards Australia’s Richest Podium
The 14-day RSI is also above the mean and below the overbought zone, which coupled with the positive cross between the conversion line and the base line is a decent positive signal; however, investors should remain cautious as the surging worries concerning the coronavirus could exert a short-term pressure on the iron ore prices, which are already estimated by many market participants to average lower ahead as the supply chain restores.
To Know More, Do Read: Mid-Year Budget Lowers Iron Ore Price Forecast; Emerging High-Yielding Dividend Opportunity?
