


The impact of COVID-19 could be seen across varying asset class with many major indices such as S&P 500, Dow Jones Industrial Average, S&P/ASX 200, trading under pressure, while safe-haven asset such as gold swiftly moving up. However, as the investing mogul- Warren Buffet suggested it is not about how the headlines are impacting the market, what we should be asking is, has the long-term perspective for major equity indices changed.
To Know More, Do Read: Volatility the Pulse of the Market: A Reading of Gold Pulse Across Multiple Time Frame
While that requires a lot of analysis to fathom out, in this article we would try to use technical analysis as our tool to address short- to the medium-term possibility of future movement across highly sought after asset class on the global as well as on the domestic front.
Before we dive deep into the charts, patterns, and indicator on our way to assess the possibility of future movement, we would like to clear one fundamental aspect of technical analysis, i.e., we would believe that irrespective of headlines or any other thing, price behaviour of the market is the ultimate guide to access out the possibilities.
Well, there are many investors, who would like to defer, it cannot be said either they would be right or wrong in doing so, and the difference of opinion between technical analysts and fundamental analyst is ever-going, with remote chances of convergence.
So, Let’s Begin!
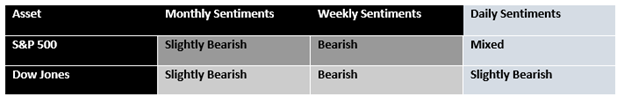
S&P 500
- S&P 500 On a Monthly Chart
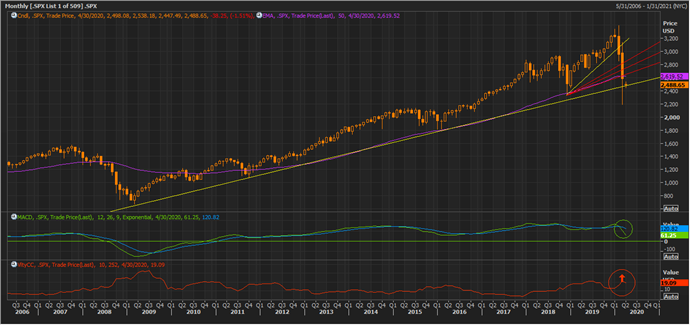
S&P 500 Monthly Chart (Source: Thomson Reuters)
On the monthly chart, it could be seen that the index did breach its long-term trend line support, of over 10 years; however, recovered to presently trade around the long-term support level (yellow line). The recent fall in the index was well supported by the rise in close-to-close volume, but the current rise is yet unable to spike the closing volume, suggesting that the recent recovery might be on a weaker footing.
Prior to slipping below the long-term trendline, the index breached below its short-term upwards sloping trendline as well (yellow short line), from which we have projected the Fibonacci fan lines (red lines), which should now act as the primary resistance levels for the index on the monthly timeframe.
The moving average convergence and divergence or MACD indicator is giving a negative signal, and a break below the long-term trendline with strong volumes along with a few days closing could indicate a change in the primary uptrend.
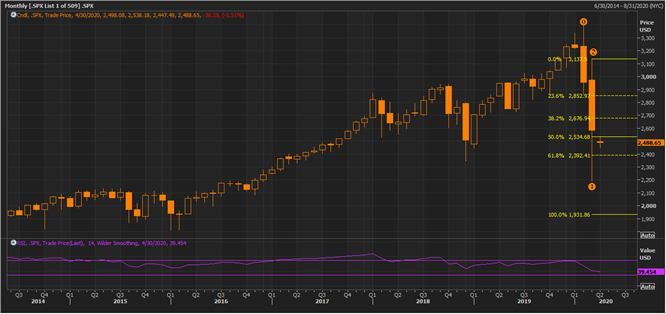
Fibonacci downside projections on the S&P 500 Monthly Chart (Source: Thomson Reuters)
- S&P 500 On a Weekly Chart
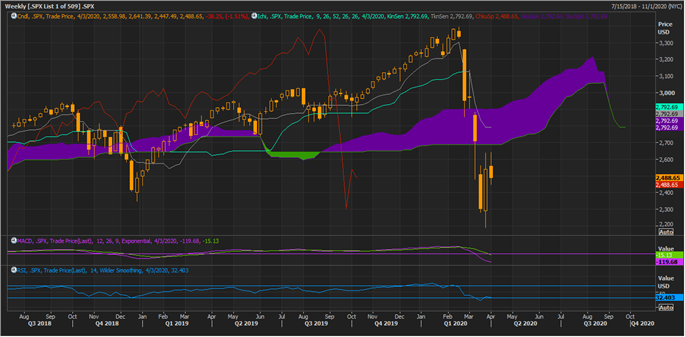
S&P 500 Weekly Chart (Source: Thomson Reuters)
On the weekly chart, the index rebounded from the support level (Span A) suggested by the Ichimoku cloud previously, however, failed to sustain, and fell below the blue cloud area, which should now act as the resistance zone for the index.
The conversion line (grey line) and the base line (sky blue) are showing a negative crossover. However, the spread between Span A and Span B is now narrowing down a little, which indicates a higher possibility of a sell-down post a slight recovery.
- S&P 500 On a Daily Chart
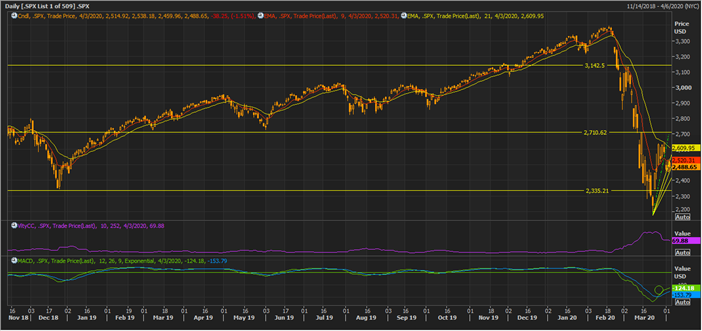
S&P 500 Daily Chart (Source: Thomson Reuters)
On the daily chart, the index is trading below 9-day and 21-day exponential moving averages with a negative crossover between them, suggesting the short-term trend is bearish in nature. However, there has been a slight recovery in the index over a daily timeframe with a positive signal from the MACD indicator.
The index has recovered with a ~ 60 degree steepness, which coupled with a missing spike in close-to-close volume indicates towards a high probability, that the recovery is either due to the short covering activities or some speculations. But as the index has recovered and its call for support level projections, which post applying the Fibonacci fan in the direction of rising, i.e., ~ 60 degree is giving the immediate support around 2,480 to 2,400.
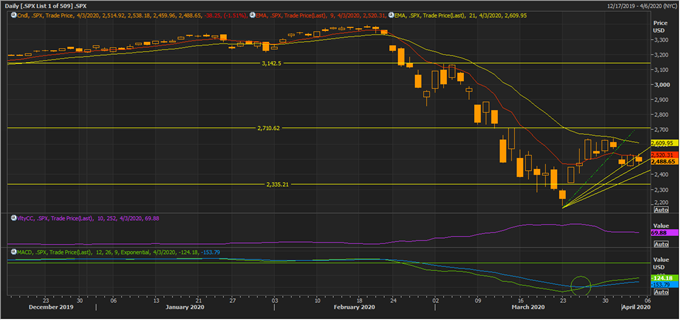
S&P 500 Daily Chart (Source: Thomson Reuters)
The primary resistance for the index is at 2,710, followed by 3,142.5.
Also, it should be noticed that the distance between the 9-day and 21-day exponential moving averages is narrowing down and the index is currently testing the 21-day EMA, and the ability of the index to close above the same would further decide the span the index spends in the positive territory over the short-run.
Dow Jones Industrial Average
- Dow Jones on a Monthly Chart
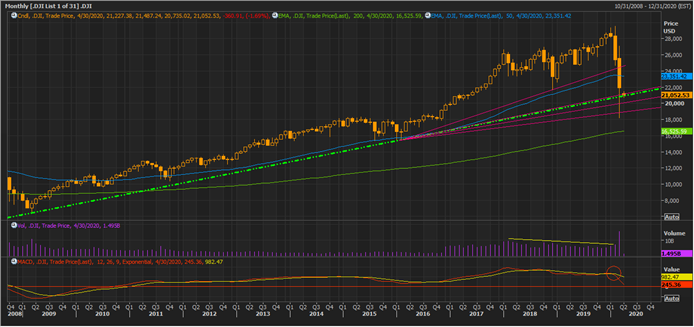
Dow Jones Monthly Chart (Source: Thomson Reuters)
On the monthly chart, the index had shown an intra-month penetration of the long-term upward sloping trendline (green dotted line); however, the index recovered with weak volumes. The MACD is showing a negative signal, and the index is still trading above the 200-month EMA. The index is trading below the short-term support line, from which the projected Fibonacci fan would now behave as support.
The index is also trading below the 50-month EMA, which would serve as the primary resistance. The index has not shown any sign of trend reversal yet; however, is trading around crucial support levels. Any break and close below the projected fan with strong volumes would increase the probability of a change in trend.
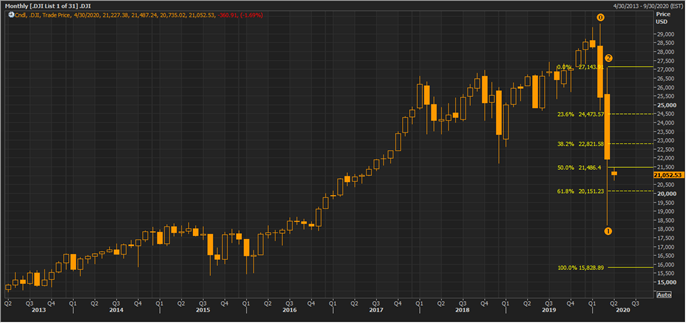
Fibonacci downside projections on the Dow Jones Monthly Chart (Source: Thomson Reuters)
- Dow Jones on a Weekly Chart
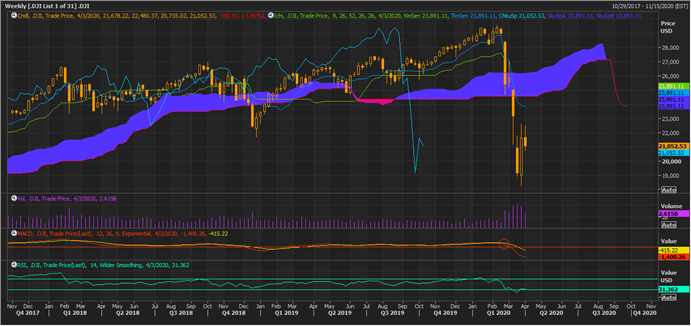
Dow Jones Weekly Chart (Source: Thomson Reuters)
On the weekly chart, the index tried to rebound from the support level (Span A) previously, however, failed to sustain, and fell below the blue cloud area, which should now act as the resistance zone for the index.
The conversion line (sky blue line) and the base line (green line) are showing a negative crossover, and the spread between Span A and Span B is now narrowing, which coupled with the falling 14-week RSI, and a negative signal from MACD suggests that the weekly timeframe yet remains bearish.
- Dow Jones on a Daily Chart
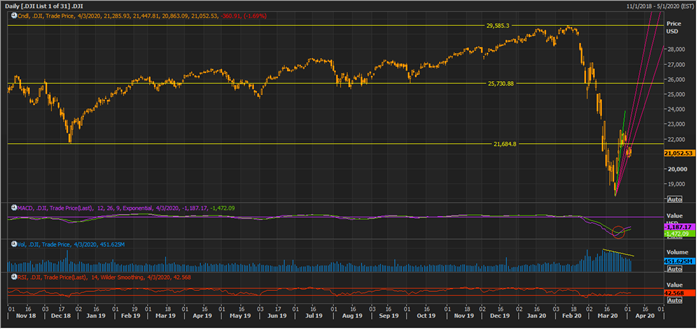
Dow Jones Daily Chart (Source: Thomson Reuters)
On the daily chart, the index rose a steepness of ~ 80 degree, which coupled with a positive crossover from MACD and falling volume suggests that the rise is either due to the short covering activities or might be speculative in nature. The support level projections, which post applying the Fibonacci fan in the direction of rising, i.e., ~ 80 degree is giving immediate support at around 21,000 to 20,800.
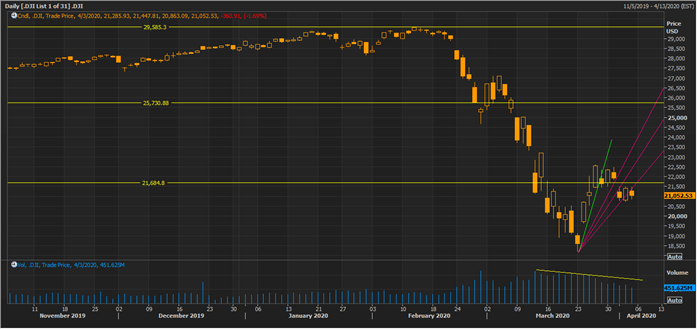
Dow Jones Daily Chart (Source: Thomson Reuters)
The primary resistance on the chart is at 21,684.8, followed by 25,730.88 and 29,585.3.
Tracking the global indices is a very important exercise for a professional investor as pre COVID-19 era we have had a highly globalised world. Thus, the global heavy weights such as S&P 500 and Dow Jones have major impact on shaping the investor sentiments in the short and medium term. As seen in the charts above, both the global indices have displayed similar patterns, in our upcoming articles we would track other major indices such as Nasdaq (US Tech Stock index), FTSE (UK Benchmark Index) and Nikkei (Japanese Benchmark Index).
