


Natural gas prices just started making recovery post a massive downturn, and Australian LNG exporter just started to enjoy the relief price recovery; however, Queensland Labour put a damper and decided to raise the taxes on the LNG exporter.
Now, as per the current regime, the producers would face increased royalties from 1st July 2019 from previous 10 per cent to 12.5 per cent, which as per the independent analystsâ estimation is expected to raise an extra $476 million in tenure of next four years for the Queensland.
The Deputy Premier of Queensland- Jackie Trad statement to media signified that the Deputy Premier tried to defend the hike, in her statement, the Deputy Premier of Queensland mentioned that ten years back Australia exported no LNG, but now, Australia is among the top three exporters of LNG in the world, and it is time for the LNG industry to do a bit more now for the state.
The Chief Executive Office of the Australian Petroleum Production and Exploration Association (APPPEA)- Andrew McConville, believes that the state of Queensland is penalising an industry, which provides thousands of jobs to the Queenslanders, and the industry did not welcome the move of the state.
In his statements to media, Mr McConville said that treasurers are using blunt instruments to raise revenue and should focus on promoting investment and growth for the long-term stream of revenues. Mr McConville also mentioned that the move by the state would increase the cost of gas production, and it would further undermine the long-term stability, which is very much required to attract the investment in the state.
In the recent status quo, the Queensland Government just offered the additional acreage to the LNG producers to overcome the supply shortage in the domestic market, and such a tax hike could impact the margins of the LNG players, and with Natural Gas prices going down in the international market, the tariff hike has the potential to distort the balance sheets of LNG producers.
Natural Gas Price Scenario:
Natural gas prices are on a continuous fall since December 2018, the prices of benchmark Natural Gas Futures on NYMEX dropped from the level of US$4.666 (high in December 2018) to the level to the present month low of US$2.305, which in turn, marks a decrease in value of more than 50 per cent in seven months.
Natural Gas on a Monthly Chart:
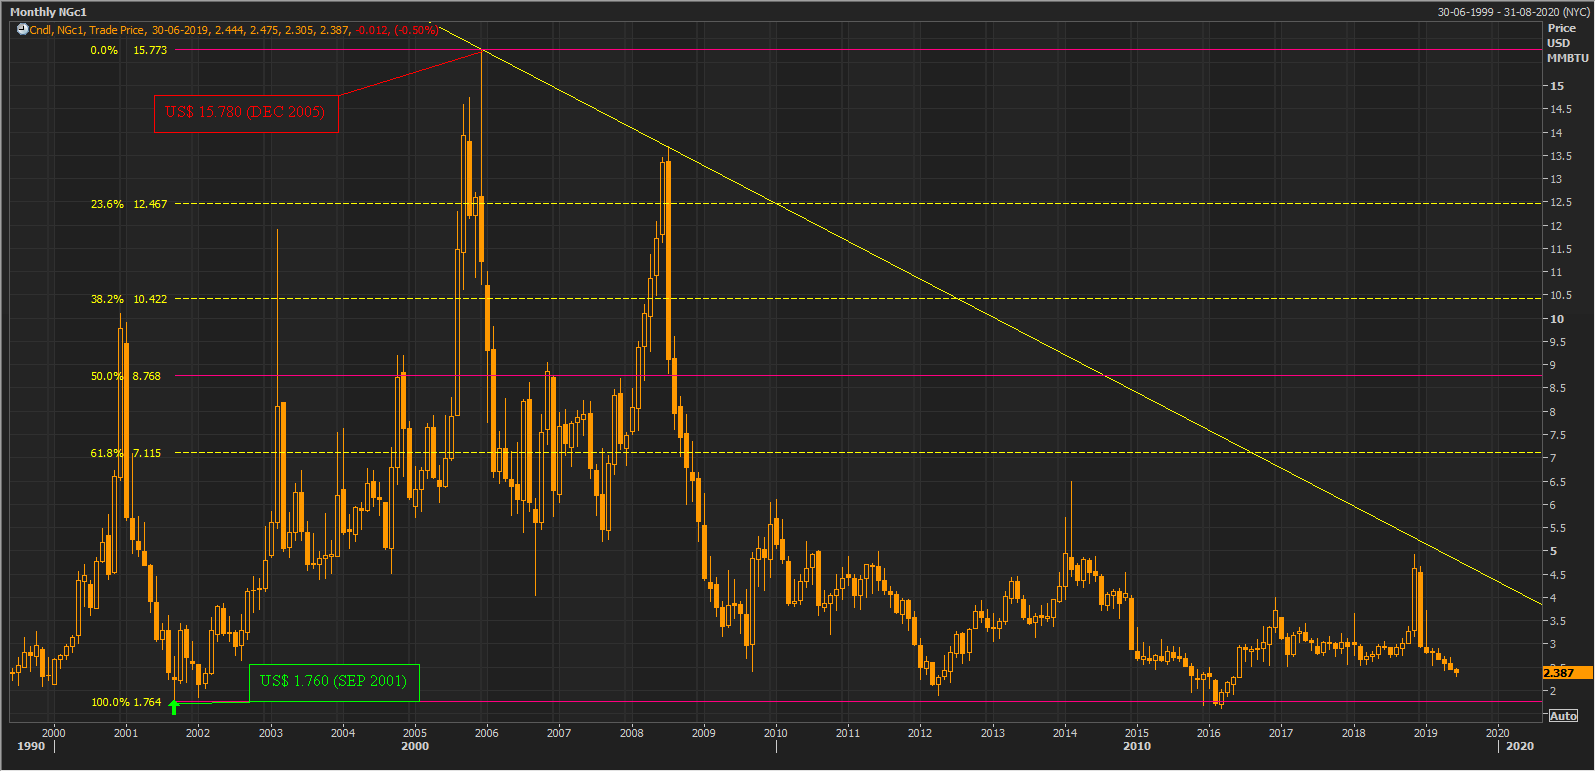
NGc1 Monthly Chart (Source: Thomson Reuters)
On a monthly chart, we can observe that the natural gas prices are free falling since December 2005. The prices initially rallied from the level of US$1.760 (low in September 2001) to the level of US15.780 (high in December 2005), which in turn marked an increase of almost 800 per cent in a tenure of 3 years and three months.
Post rallying to the level of US$15.780, the prices took a massive fall and dropped in late 2006; however, the prices again picked up and rose in late 2008, but the price upsurge could not take the prices above its previous December 2005 high of US$15.780, which in turn, marked the starting of the downtrend and provided the points for the yellow downward sloping trendline.
During the massive drop from US$15.780, the prices tried many upside moves but faced the hurdle of the downward sloping trendline and fell to the present level of US$2.387 (as on 12th June 2019 AEST 7:54 PM).
The prices have corrected by 100 per cent of the rally which started from September 2001 and is currently nearing the support of 100 per cent Fibonacci retracement line, which it has breached previously but rebounded back.
Apart from the support of 100 per cent Fibonacci retracement, the prices are also taking the support of the 100 per cent Fibonacci projections.
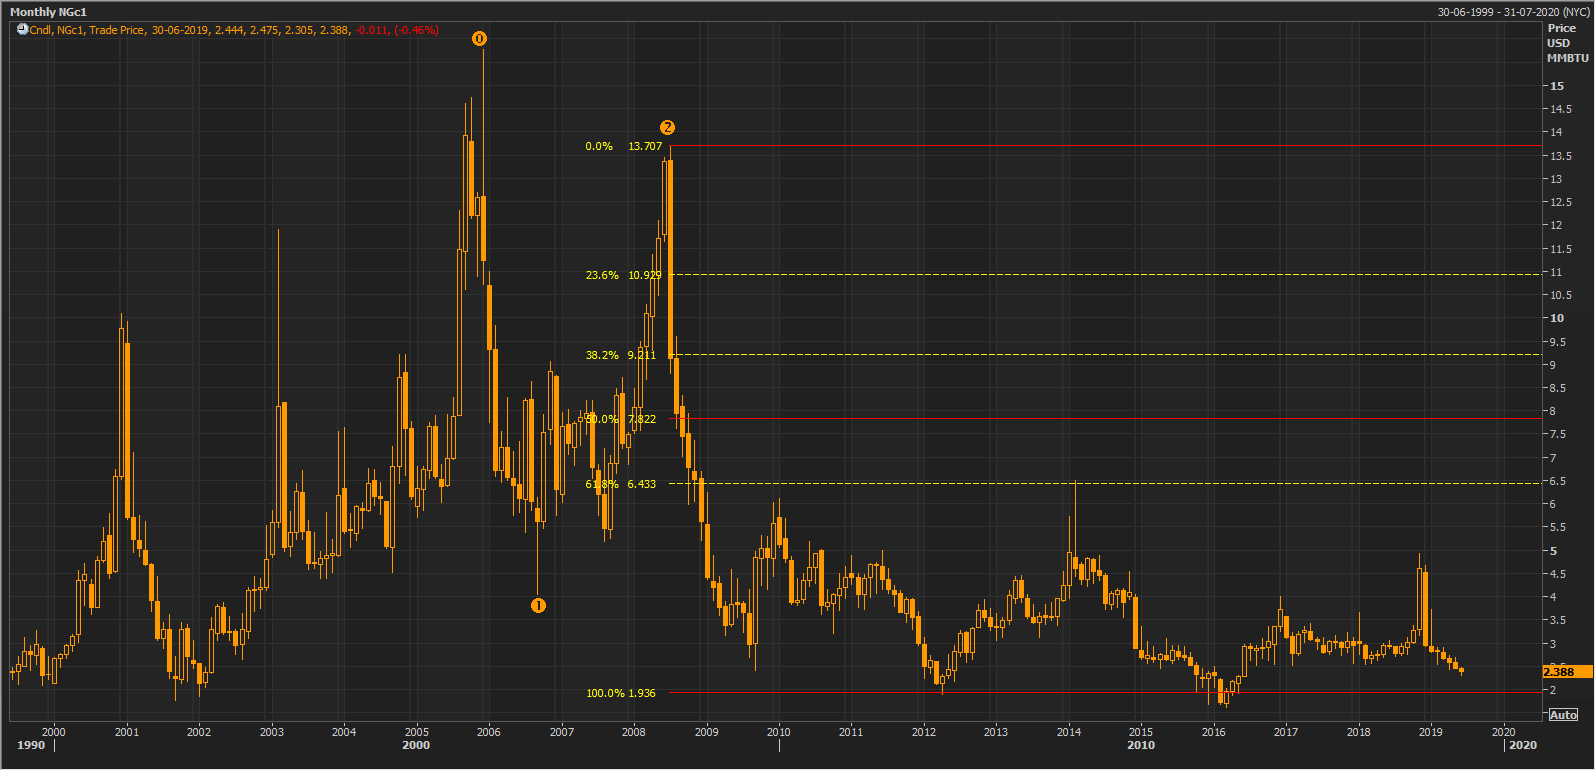
NGc1 Monthly Chart (Source: Thomson Reuters)
The Fibonacci retracements are connected with points marked on the above charts as 0,1,2. The prices have breached the projection level of 100 per cent in early 2016 but rebounded back.
Movement since 2008:
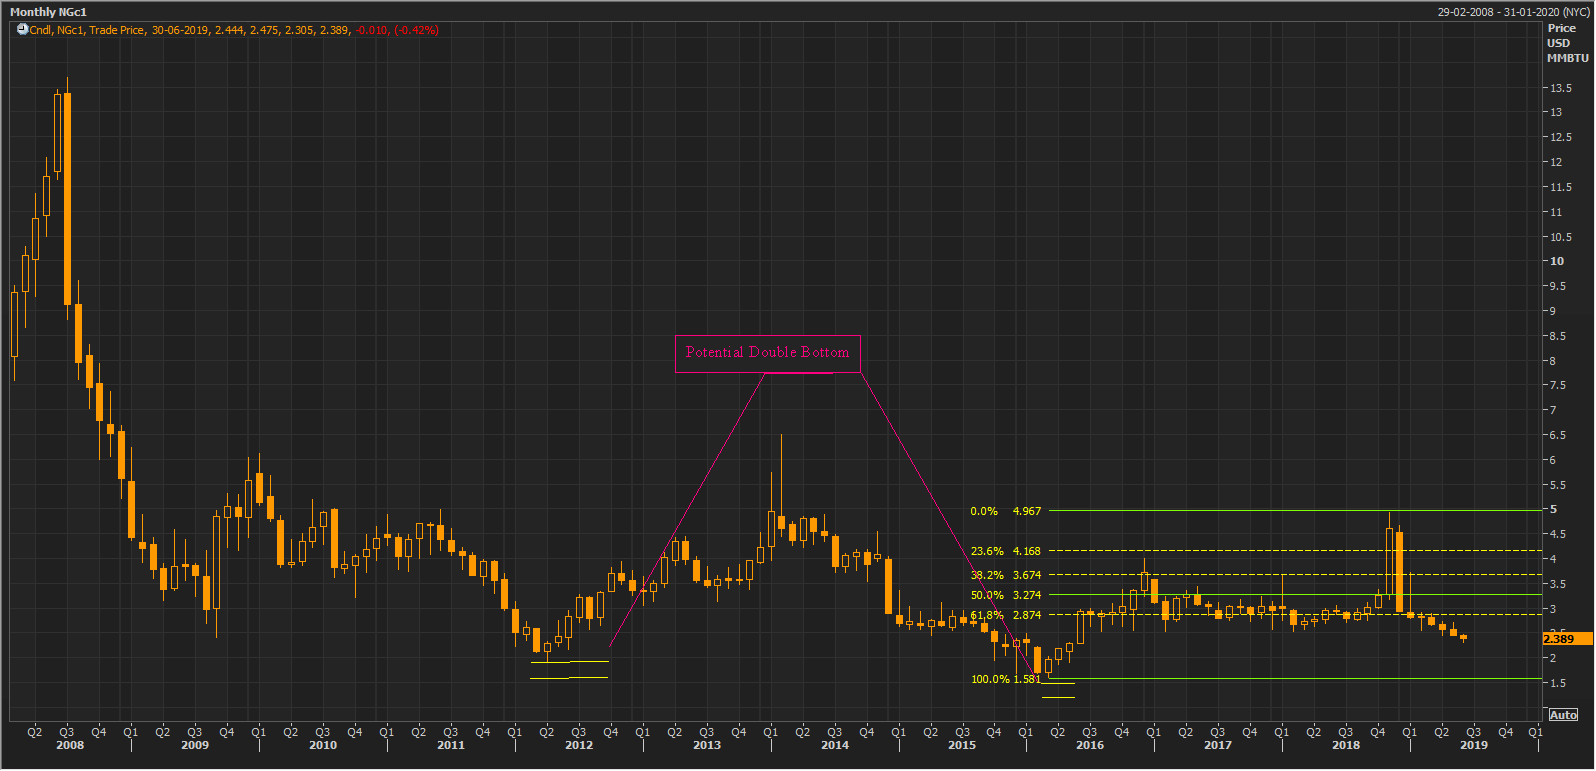
NGc1 Monthly Chart (Source: Thomson Reuters)
On further narrowing down the focus on the price actions since the year 2008, we can see that the approximate level of support zone during the second quarter of the year 2012 and the early part of the second quarter of the year 2016 are almost same (considering the monthly movement).
The price rebounding back from same level/zone, in a downtrend establishes a potential double bottom, which is a bullish trend reversal pattern. On further analysing the price actions from the level of A$1.581, we can see that the prices are gaining upside momentum and have retraced by more than 61.8 per cent of the small rally started from US$1.581 to the level of A$4.967.
Natural Gas on a Daily Chart:
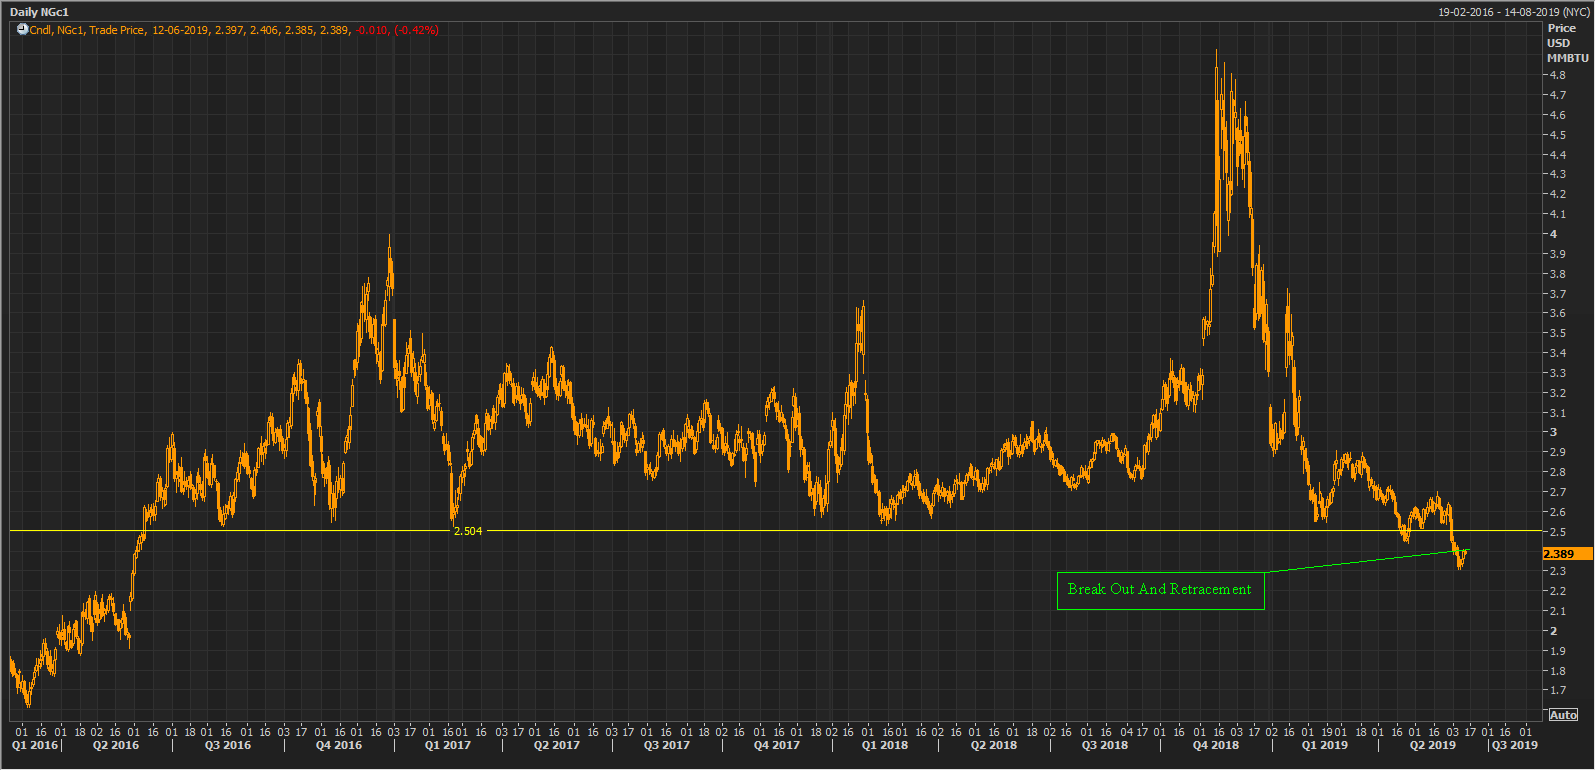
NGc1 Daily Chart (Source: Thomson Reuters)
On following a daily chart, it can be seen that the natural gas prices broke its support level, but in the recent scenario, the prices are moving towards the support line again. However, this time, the support could act as a resistance level and the price breaking and sustaining above the resistance would decide the further price movement.
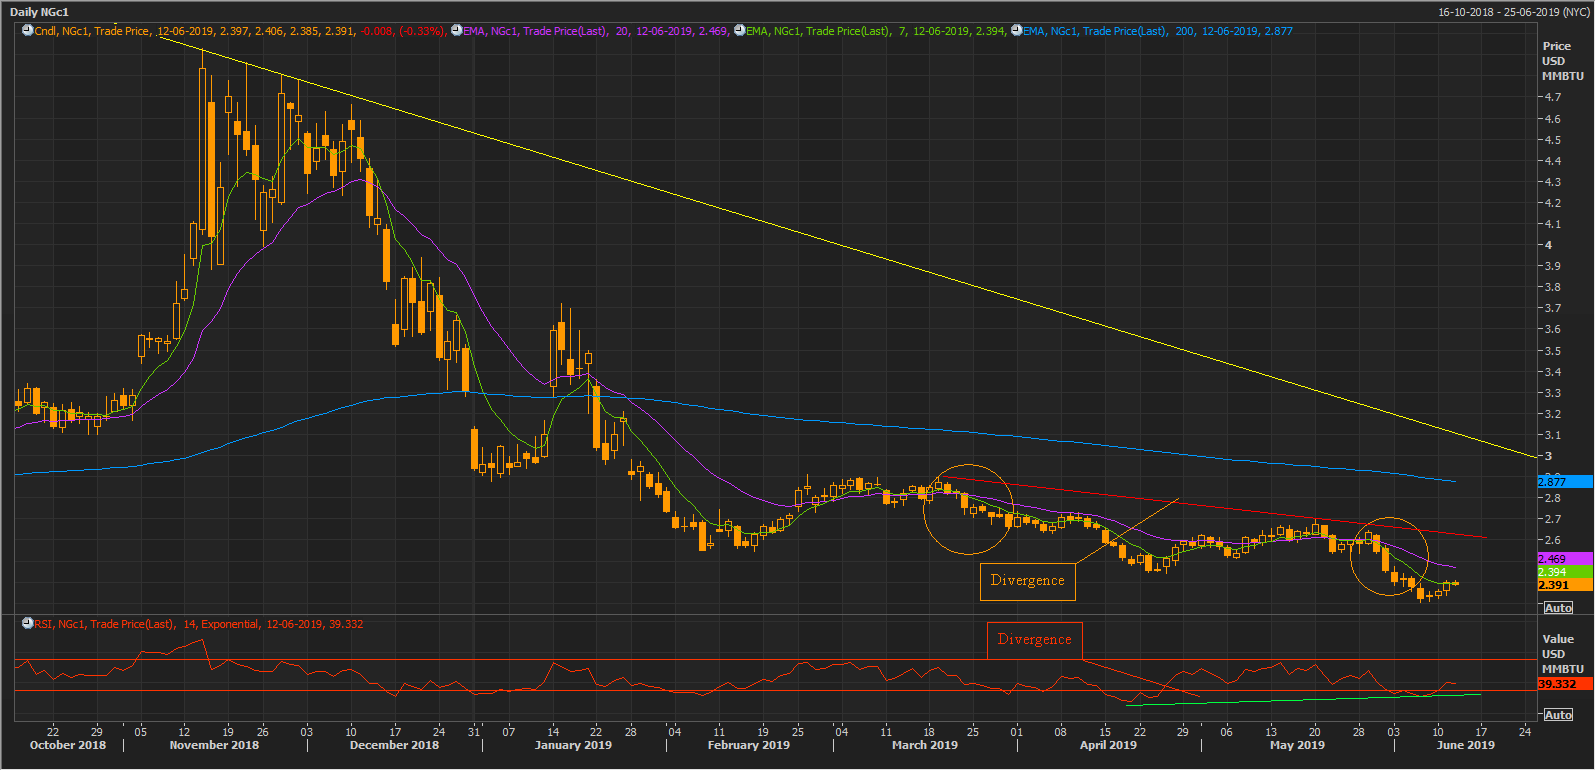
NGc1 Daily Chart (Source: Thomson Reuters)
On further observing the daily chart carefully, we can see that the prices are trading below the trio of 7, 20, and 200-days exponential moving averages (EMAs). The 7-days exponential moving average is at US$2.394, while the 20-days exponential moving average is at US$2.469, and 200-days exponential moving average is at US$2.877.
The trio marked a death cross (bearish signal) on a daily chart twice, which is shown on the chart above with circles. However, on the indication front, we can notice a bullish divergence between the price actions and 14-days period Relative Strength Index.
The divergence is present as the prices have breached its previous lows, but the 14-days Relative Strength Index did not on a daily chart. The divergence is shown with a red and a green line, which is acting as the mirror image for each other.
In a nutshell, the price actions are showing some mixed responses, and the recent hike in tax for the operators could be problematic as a low price could reduce the average realised sales proceed and higher taxation could lead lower cash flows and increased production cost.
Disclaimer
This website is a service of Kalkine Media Pty. Ltd. A.C.N. 629 651 672. The website has been prepared for informational purposes only and is not intended to be used as a complete source of information on any particular company. Kalkine Media does not in any way endorse or recommend individuals, products or services that may be discussed on this site. Our publications are NOT a solicitation or recommendation to buy, sell or hold. We are neither licensed nor qualified to provide investment advice.
