


The financial sector incorporates an array of organisations from insurance companies and investment companies to commercial banks and provider of financial services. Australia’s financial sector is one of the largest in the world, holding the 6th biggest managed fund assets pool. In the S&P/ASX 200 index, the financial sector is a leading contributor with a share of ~29.7%. Five of the top 10 companies by index weight on the ASX are financial sector companies.
The sector has remained steady during a period of uncertainties and concerns, including political conflicts and deteriorating trade relations. In 2019, the financial sector performed reasonably well with a return of 7.39% in the 12-month period. The sector has been in the green in 2020 as well with a YTD return of 5.06% (as on 10 February 2020).
In this article, we will look at two ASX-listed financial stocks that function in different industries within the financial sector: Genworth Mortgage Insurance Australia Limited and Janus Henderson Group Plc.
Genworth Mortgage Insurance Australia Limited (ASX:GMA)
Headquartered in Sydney, Australia, Genworth Mortgage Insurance Australia Limited engages in the provision of lenders mortgage insurance (LMI). The company also focusses on capital management as well as risk solutions in the country’s market for residential mortgage. Genworth has a strong presence in the country having business relations with more than 100 lenders, including three of the largest banks.
Genworth reports robust FY 2019 results (period ended on 31 December 2019); statutory NPAT grows 58.65%
GMA announced its FY 2019 results on 05 February 2020 with the company reporting a strong performance, in line with its guidance. Following are the key highlights of the financial performance:
- Statutory net profit after tax or NPAT stood at $120.1 million, a significant increase compared to FY 2018 figure ($74.7%)
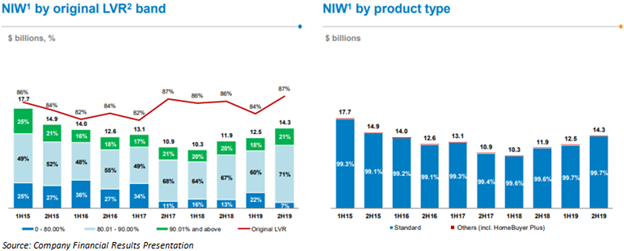
- New Insurance Written (NIW) rose 20.3% to reach $26.7 billion (FY 2018: $22.7 billion)
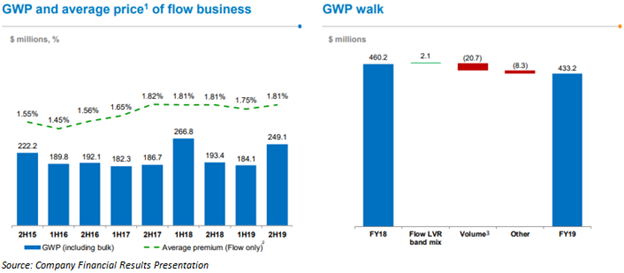
- Net Earned Premium (NEP) was 6% higher on previous year’s figures and above guidance (-5% to 5%)
- The loss ratio was within the guidance range of 45%-55% at 50.6%
- Unearned Premium Reserve was up by $0.1 billion to reach $1.3 billion
GMA launched its new offering last year, the LMI offering, and introduced its automated underwriting decision platform (eLMI portal).
2020 Outlook: Guidance in line with FY 2019 Guidance
The company believes that FY 2020 results depend on various factors, including:
- Housing market gain, especially in the major cities including Perth, Melbourne and Sydney
- Unemployment rates and labour market capacity
- Household income growth as well as the consumer confidence level
- Mortgage interest rates changes as the company believes lenders will look for opportunities for business growth by enticing borrowers
- Improvement in regulatory compliance and insurances fees, impacted by general market scenario
- Australian government’s First Home Loan Deposit Scheme’s influence
- Impact of recent bushfires
The company has set a NEP range of -5% to 5% for FY 2020 and the loss ratio to be in the range of 45% - 55%. Genworth aim at a dividend payout range of 50% - 80%.
Dividend Distribution Announcement
On 05 February 2020, GMA announced a final ordinary dividend of $0.075 (fully franked), i.e. 7.5 cents per share, on the security GMA - ORDINARY FULLY PAID. The ex-date 04 March 2020 and the dividend payment date is 19 March 2020.
Genworth announces the appointment of CEO and Director
On 24 January 2020, the company announced the appointment of Ms Pauline Blight-Johnston as the CEO and MD, effective 02 March 2020. Ms Blight-Johnston will replace the acting CEO, Mr Duncan West. The new CEO will be appointed to the board as a Genworth Financial, Inc. (GFI) designee, replacing Mr West.
Stock Performance
Genworth’s shares last traded at $3.830 on 10 February 2020, a decline of 0.519% compared to the previous day’s close. GMA had a market capitalisation of $1.59 billion, and outstanding share of 412.51 million. The annual dividend yield was 4.29%, and the P/E ratio was 13.650x. The company delivered positive returns of 36.13% and 76.92% in the last six months and last 12 months, respectively.
Janus Henderson Group Plc (ASX:JHG)
Established in 2017 from the merger of Janus Capital Group and Henderson Global Investors, Janus Henderson Group Plc is an active asset manager that offers an array of investments solutions including fixed income, multi-asset strategies, equities, and quantitative equities, among others.
The dual-listed company is headquartered in London, the UK and has an AUM of ~US$375 million.
Janus reports Q4 and FY 2019 results for the period ended on 31 December 2019, with AUM increasing by 14%
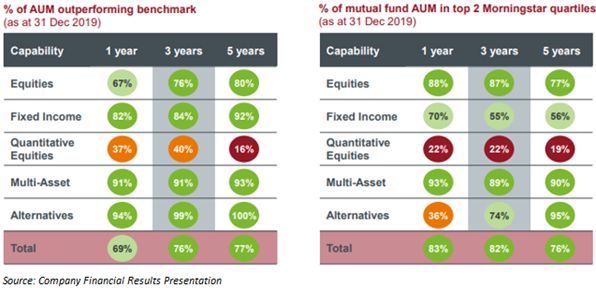
JHG announced its Q4 and FY 2019 results on 04 February 2020 with strong investment performance. 76% and 77% of the AUM outpaced the benchmarks on a three and five-year basis, respectively.
During FY 2019, the investment performance of the company was reinforced. Following are some of the key highlights:
- Total AUM rose 14% led by strong markets but partially negated by net outflows
- Adjusted diluted EPS stood at US$2.47, a decline from US$2.74 reported in FY 2018. However, for 4Q 2019, the adjusted diluted EPS at US$0.65 was slightly higher than US$0.64 in FY 2018
- Dividend per share increased from US$1.40 in FY 2018 to US$1.44
- The company completed a buyback worth US$200 million in FY 2019. JHG’s board has approved an additional authorisation of the same amount in FY 2020
- Stronger investment performance with 76% of AUM exceeding benchmark on a three-year basis compared to 61% in FY 2018
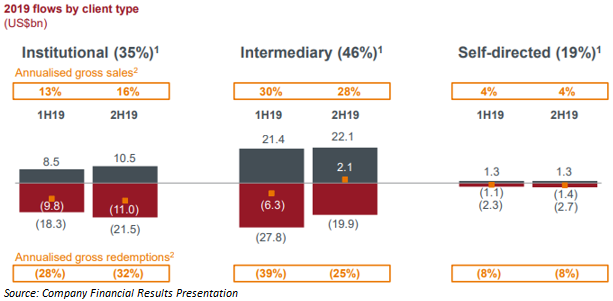
- 2019 outflows indicate a considerable improvement in Intermediary with improved outflows in Institutional
Strong Investment Performance
Encouraging 2020 Outlook
JHG believes that the improved investment performance, its ability to win new businesses, attractive and capable present team, and its financial strength make the company’s outlook look bright.
The company is focused on gaining market share in important retail markets, and its new institutional business is upgrading pipeline. Also, the strategic products grew substantially across its investment solutions.
Janus Henderson’s strong cash flows and balance sheet puts the company in good stead for investments in future growth amidst the evolving needs of the consumers.
Dividend Distribution Announcement
On 05 February 2020, Janus Henderson announced a final ordinary dividend of US$0.36 on the security JHG - CHESS DEPOSITARY INTERESTS 1:1. The ex-date 17 February 2020 and the dividend payment date is 05 March 2020.
Stock Performance
Janus’ shares last traded at $39.140 on 10 February 2020, a decline of 2.37% compared to the previous day’s close. The 52-week low and high prices were $26.110 and $41.320, respectively. The P/E ratio being 13.000x, the company delivered positive returns of 40.17% and 23.89% in the last six months and last 12 months, respectively.
