


Iron ore prices are climbing the ladders in the international market as steel mills in China stockpiles ahead of the week-long National Day break starting from 01 October 2019, which in turn, is fanning the ASX-listed iron ore stocks.
Nitty-Gritty of the Iron Ore Market
The iron ore inventory across the 35 significant ports in China shrank by 0.35 million tonnes to settle at 110.30 million tonnes (as on 06 September 2019), down by 0.32 per cent from the previous week level. The iron ore stockpiles across the ports further declined by 1.55 million tonnes to stand at 108.75 million tonnes (as on 12 September 2019).
The iron ore inventory declined across the Chinese ports amid increased buying from the steel mills. The daily iron ore deliveries from the 35 substantial ports in China averaged at 2.9 million metric tonnes (as on 12 September 2019), up by 27,000 metric tonnes from the previous week. The increase in the daily average deliveries marked the fourth consecutive week of uptick.
The falling inventory and decent buying from the Chinese mills ahead of the Mid-Autumn Festival holiday (ended on 16 September 2019) supported the iron ore price.
Steel Inventory Plunge in Chin
Apart from a decline in the iron ore inventory, a decline in steel inventory in China also prompted mills to engage in stockpiling ahead for the national daybreak, which in turn, fuelled the iron ore prices in the international market.
As per the data, the steel inventory in China descended by 3.66 per cent or by 0.53 million tonnes to settle at 13.94 million tonnes for the week ended 06 September 2019.
Further, the steel rebar inventory sank for the fifth consecutive week on 12 September 2019, and as per the data, the rebar inventories across the social warehouses declined by 6.8 per cent to stand at 5.49 million metric tonnes.
Not just the social, the steel rebar inventories across the steel plants also nose-dived by 8.2 per cent to stand at 2.2 million metric tonnes (for the week ended 13 September 2019).
The social inventory of the hot-rolled coil (or HRC) fell for the fifth consecutive week (as on 12 September 2019). As per the data, the social inventory of HRC declined by 2 per cent to stand at 2.32 million metric tonnes on 12 September 2019.
The inventory across the steel plants decreased by 5 per cent to stand at 962,000 million metric tonnes (as on 12 September 2019).
The plunge in steel inventory, across both social and steel mills supported the iron ore prices in the international market.
Iron Ore Price Rush
The iron ore rose significantly in the domestic market of China, and the prices shot up by from the level of RMB 591.00 (Dayâs low on 28 August 2019) to the level of RMB 681.00 (Dayâs high on 13 September 2019) on the Dalian Commodity Exchange, which underpinned a rally of over 15 per cent.
Likewise, the prices of iron ore at the Chicago Mercantile Exchange rose from the level of US$80.16 a tonne (Dayâs low on 27 August 2019) to the level of US$94.77 (Dayâs high on 13 September 2019), which represented an upside of over 18 per cent.
Is Iron ore Entering the Buy Zone?
Factors in Favour of a Buy
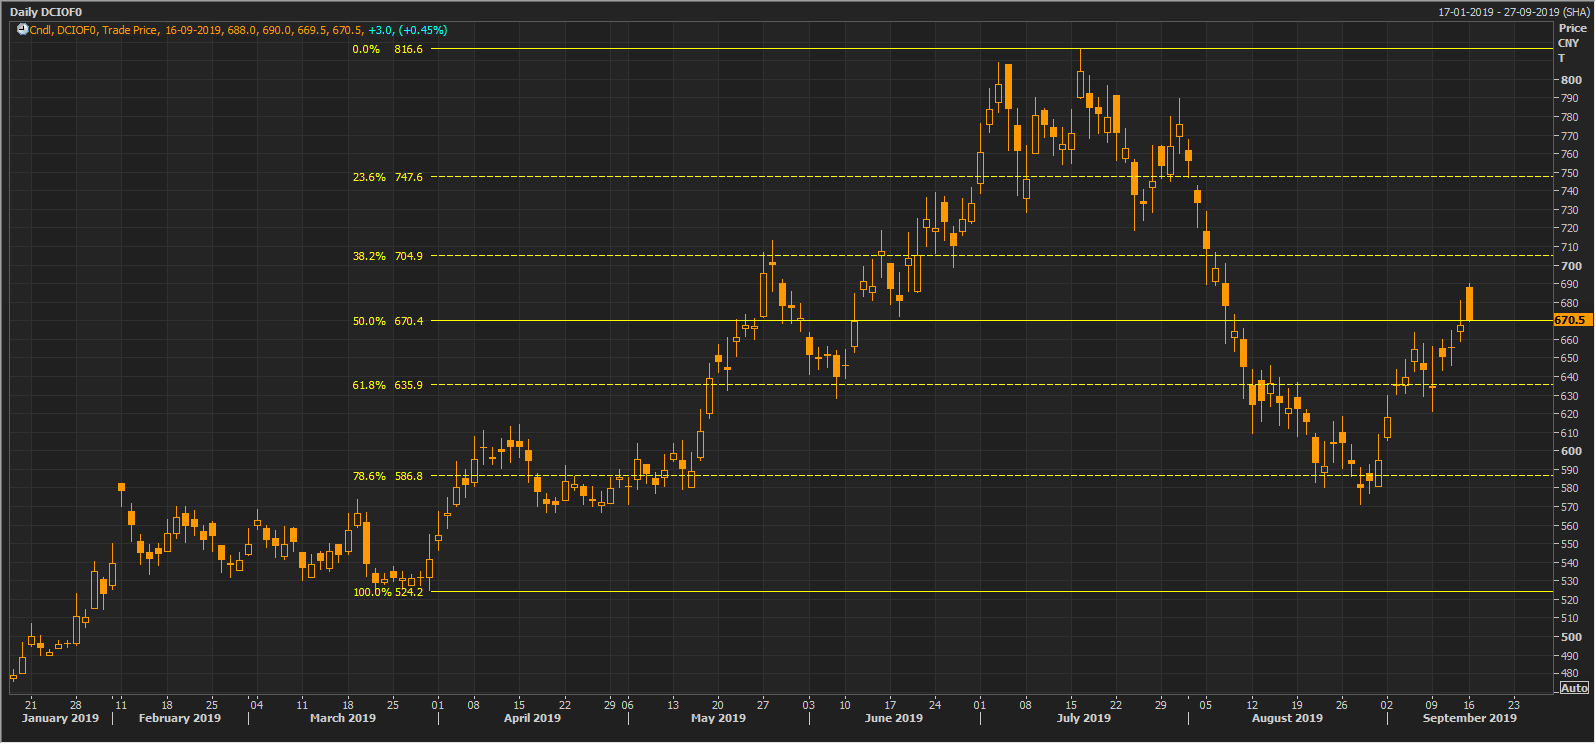
Daily Charts DCIOFO (Source: Thomson Reuters)
On the daily chart, iron ore prices are rising post a correction of over 78.6 per cent of the primary rally, which started from the level of approx. RMB 524.2 to the level of RMB 816.6. The academics suggest that the correction of over 78.6 per cent of any upside rally usually generates buyersâ interest. Thus, the upside in the iron ore prices followed by a correction of over 78.6 per cent supports the buy.
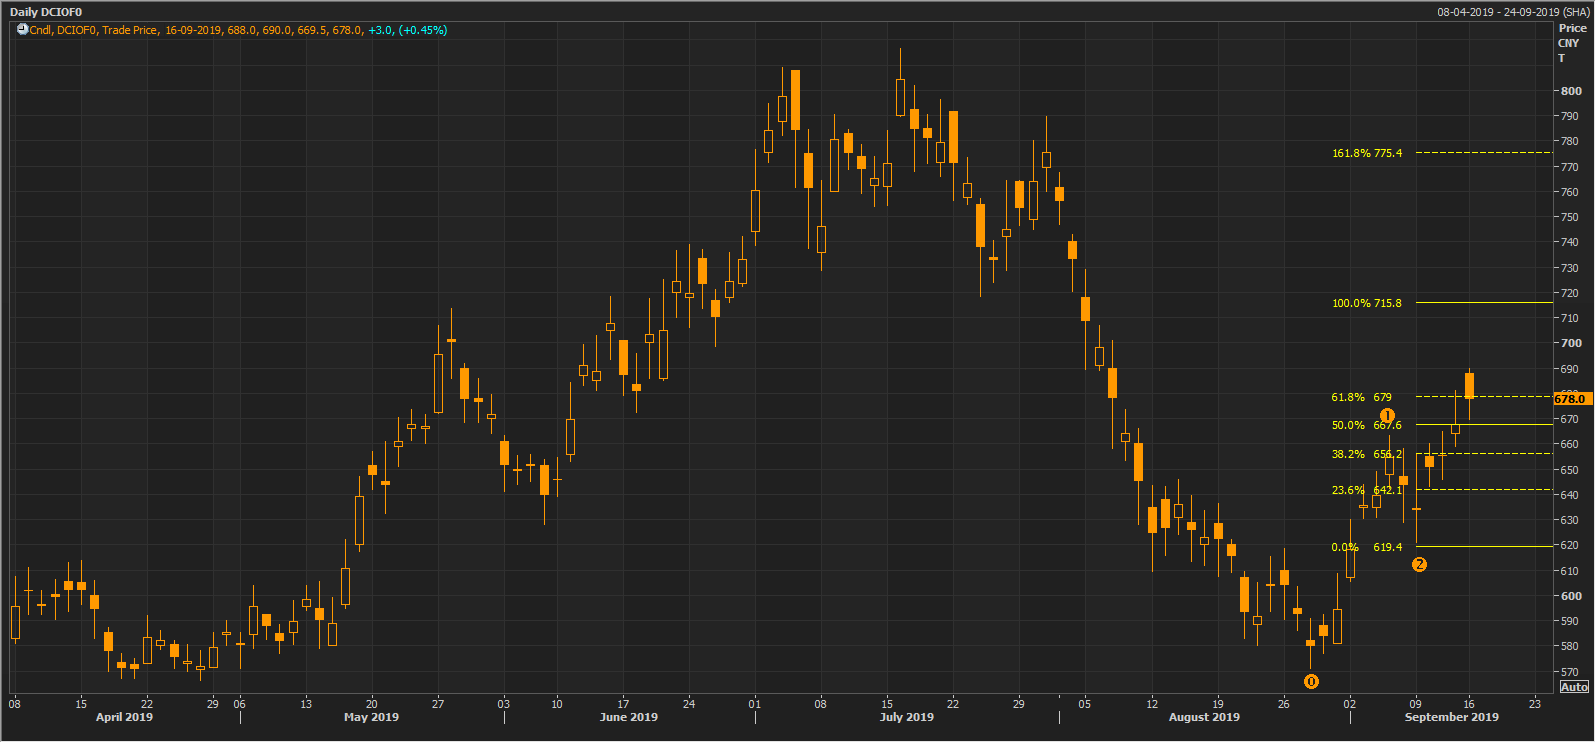
Daily Charts DCIOFO (Source: Thomson Reuters)
On further analysing the daily chart and post following the Fibonacci projections, we can observe that the iron ore prices have breached the hurdle level of RMB 679, which is at 61.8 per cent of the projected level. The level of 61.8 per cent (or RMB 679.00) could now act as the support for the prices to push it forward till the level of RMB 715.8 (or 100.0 per cent of the projected level).
The breaching of the 61.8 per cent Fibonacci level and projected series also support the short-term buy.
Factors Aginst the Bulls

Daily Charts DCIOFO (Source: Thomson Reuters)
On the daily chart, the iron ore price actions are forming a potential bearish flag pattern (bearish pattern). The prices are now moving towards the upper band of the flag channel, which could act as a major hurdle for the prices.
If the prices rebound from the upper band to fall back and consequently breach the lower band of the flag channel, it would confirm the bearish flag pattern formation.
Such bearish pattern formation stacks against the bulls.
Another factor, which is against the bulls is the decline in volumes. Despite, prices being trailing high, the volumes are showing a decline, which could suggest the exhaustion of the bullsâ power to further lead the price actions.
ASX Iron Ore Stocks
Despite a mixed scenario for the future of iron ore, the ASX-listed iron ore miners relished over the rise in iron ore prices.
The behemoth Australian miner- Rio Tinto (ASX: RIO) rallied from the level of A$82.690 (low for the week ended 26 August 2019) to the present level of A$94.110 (Dayâs close on 16 September 2019).
The stock rallied for past three consecutive weeks and ended the session today on ASX approx. 0.88 per cent higher against its previous close.
Also Read: Twin Shocks of Copper and Iron Ore Set Rio and BHP Uptrend on a Detour
Likewise, other ASX-listed iron ore miners such as BHP, FMG, S32, etc., followed a similar trajectory.
The iron ore mammoth-BHP Group (ASX:BHP) rallied from the level of A$34.430 (low for the week ended 26 August 2019) to the level of A$38.300, up by over 11 per cent. The stock started the dayâs session with a large runway gap-up today (16 September 2019) on ASX supported by the crude oil and iron ore prices.
BHP started the session today on ASX at A$39.320, up by approx. 6 per cent to reach the high of A$39.325.
Also Read: BHPâs Pessimism Drags Iron Ore Down; While 62 per cent Fe Struggles to Rebound
Fortescue Metals Group Limited (ASX: FMG) rose from the level of A$7.210 (low for the week ended 26 August 2019) to the level of A$9.120 (Dayâs high on 13 September 2019), which in turn, underpinned the growth of over 26 per cent.
FMG witnessed a rally for past three consecutive weeks and traded lower and flat around its 13 September 2019 high of A$9.120.
In a nutshell, the iron ore prices rallied amid procurement from the steel mills, which reduced the iron ore inventory across the Chinese ports, which further propelled the ASX-listed iron ore stocks on the exchange.
However, the daily chart is sending a mixed sentiment over the price run, and investors should closely track the levels mentioned above.
Also Read: Australian Iron Ore Miners- RIO, FMG, And BHP Dashes; Bearish Cue On Charts Persist
Disclaimer
This website is a service of Kalkine Media Pty. Ltd. A.C.N. 629 651 672. The website has been prepared for informational purposes only and is not intended to be used as a complete source of information on any particular company. Kalkine Media does not in any way endorse or recommend individuals, products or services that may be discussed on this site. Our publications are NOT a solicitation or recommendation to buy, sell or hold. We are neither licensed nor qualified to provide investment advice.
