


Buy Now Pay Later (BNPL) space, which has been amongst the hardest hit sectors amidst huge sell-off in the stock market; however, the BNPL sector is now showing some promising recovery with stocks such as Afterpay Limited (ASX: APT), Pushpay Holdings Limited (ASX:PPH) recovering post retracing significantly in the wake of the panic global market sell-off.
- APT On A Weekly Chart
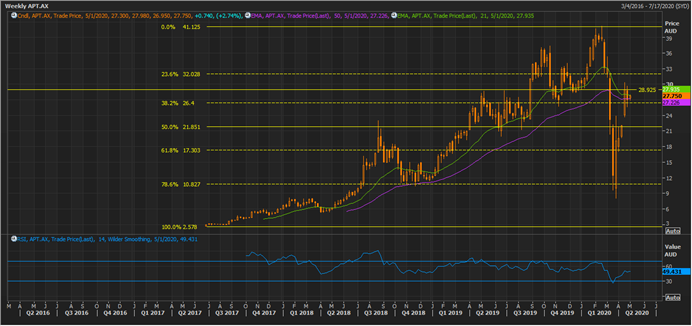
APT Weekly Chart (Source: Thomson Reuters)
On the weekly chart, it could be seen that the stock has corrected 78.6 per cent of the primary uptrend before rising back to the 50-week exponential moving average, which is at $27.226. Also, the stock is trying to test the long-term horizontal resistance line which is at $28.925.
Currently, the short-term exponential moving average (21-week) and long-term exponential moving average (50-week) is showing a positive cross, which coupled with a price recovery and increasing average true range suggests that the bulls having an upper hand; however, the break and sustain above the resistance or failure to do so would decide further bulls or bears participation in the stock.
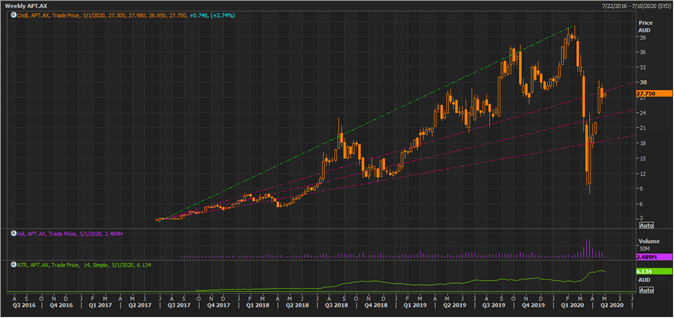
APT Weekly Chart (Source: Thomson Reuters)
On further projecting the Fibonacci fan from the lowest point to the highest point on the weekly timeframe, it could be seen that the stock is currently trying to test the 1/3 fraction of the fan, which could be an immediate hurdle for the stock.
While the stock is testing the resistance zone, the volume is slightly larger as compared to- the historical nominal volumes, which coupled with a spiked volatility (as reflected by the increase in average true range) suggesting that the stock might give a volatility breakout, which should be closely monitored.
- APT On A Daily Chart
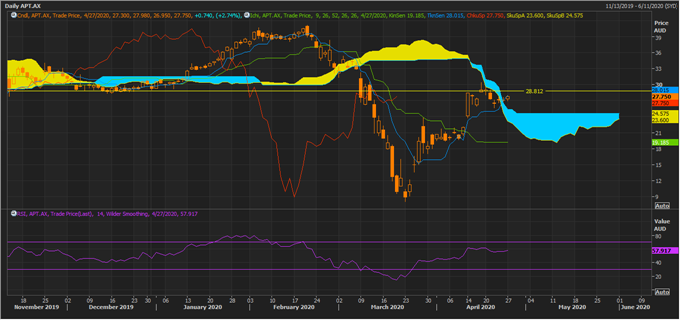
APT Daily Chart (Source: Thomson Reuters)
On applying the Ichimoku clouding technique on the daily chart, it should be noticed that the stock is currently trading above Span A (which is the mean value of the conversion line and the base line) with a positive crossover between the conversion line (blue)- which represents the mean value of 9-day high & low and the base line (green)- which represents the mean value of 26-day high & low.
Also, the spread between Span A and Span B (mean value of 52-day high and low) is slightly increasing, which coupled with an above mean 14-day Relative Strength Index, reflects that the uptrend is gaining some momentum, which could test the resistance at $28.18, break and sustain above or failure to do so which would decide further price behaviour of the stock.
- PPH On A Weekly Chart
PPH Weekly Chart (Source: Thomson Reuters)
On the weekly chart, it could be seen that the stock had recovered ~ 61.8 per cent of the primary up rally, which started from ~ $1.243 and ended at ~ $4.732. Post retracting 61.8 per cent of the primary rally, the stock has breached its primary resistance line (red line), which would now act as the support for the stock.
On closely monitoring the historical price behaviour it could be noticed that the stock has tested the green line previously, but failed to sustain and retracted to 61.8 per cent level of the primary rally, and the same green line should now act as an immediate resistance for the price, and investors should monitor both the support and resistance closely, as a break above or below them, respectively would determine further price behaviour of the stock.
The short-term exponential moving average (21-week) is trading above the long-term exponential moving average (50-week), confirming that the current trend is an uptrend.
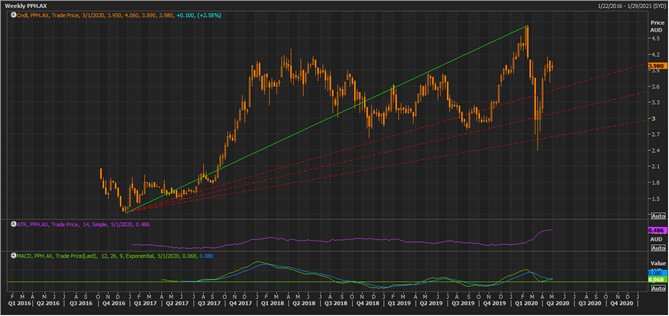
PPH Weekly Chart (Source: Thomson Reuters)
On further projecting the Fibonacci fan from the lowest to the highest point on the chart, it could be noticed that the stock took the support of the 3/3 fraction of the fan and surged. Now, the 1/3 fraction of the stock should act as secondary support.
The 12-week MACD or moving average convergence & divergence indicator is given a positive cross, which coupled with a spike in the average true range suggests that bulls could take charge ahead, provided that the stock should breach the resistance with decent volume and remain able to sustain.
- PPH On A Daily Chart
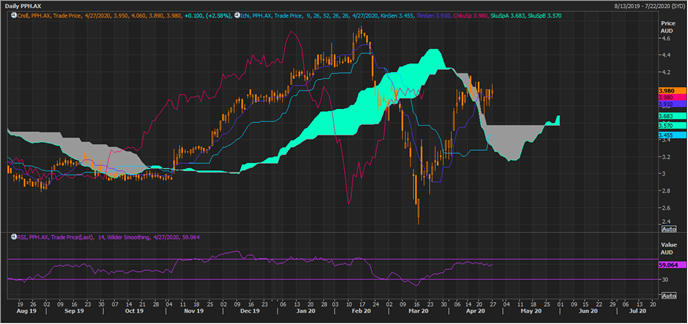
PPH Daily Chart (Source: Thomson Reuters)
On the daily chart, it could be seen that the stock is trading above Span A with a positive crossover between the conversion line and the base line. The grey cloud zone would be the support area for the stock, and now, the spread between Span A and Span B is enlarging, which coupled with an above mean 14-period RSI suggests that the uptrend is in momentum.
To conclude:
Both the BNPL players- APT and PPH, are currently showing strength and trading near resistance with positive bias. The next upcoming moves in the stock price could be interesting.
