


Gold prices are tumbling in the international market; the prices of Gold Spot plunged from the level of US$ 1346.79 (Dayâs high on 20th February 2019) to the level of US$ 1266.35 (2nd May 2019).
The prices fell in the international market previously over the optimism among market participants over the global economic conditions amid the trade talks between the United States and China.
However, the outcome of the trade talks came entirely opposite of what the market participants expected. The United States moved against China and raised tariffs from 10 per cent to 25 per cent. Due to re-escalation of the bilateral disagreement, China retaliated and raised the tariff on U.S goods, which in turn, marked the beginning of U.S-China trade war 2.0.
This time the market behaved unusually and reckoned that the United States is in greater leverage in this U.S-China trade war, which in turn, marked a rush towards dollar and dollar prices soared. The Dollar Index rose from the level of US$95.03 (Dayâs low on 10th January 2019) to the level of 98.37 (Dayâs High on 23 May), which in turn, exerted pressure on the gold prices.
However, the fixed income market took caution over the re-escalated trade war, and despite a fall in gold prices, the fixed income segment did not raise the market discount rate or yield-to-maturity. The yield on the 10-year United States treasury bills declined from the level of 3.250% (Dayâs high on 7th November 2018) to the present level of 2.234% (as on 29th May 2019 AEST 8:19 PM).
The entirely different behaviour of the bond market as compared to the behaviour of the currency market suggested that the market view over gold is dissected among different aspects.
But, in the recent event, the economic figures in both the United States and China dropped, which in turn, suggested that the impact of the trade tiff is becoming evident in terms of outcomes which supported the gold prices recently.
Over the evident outcomes of the trade dispute, gold prices recovered from the level of US$1269.57 (Dayâs low on 21st May 2019) to the level of US$1287.45 (Dayâs high on 27th May 2019).
The prices are currently hovering around the same level of approx. US$1285 (as on 29th May 2019 AEST 8:34 PM).
Technical Outlook:
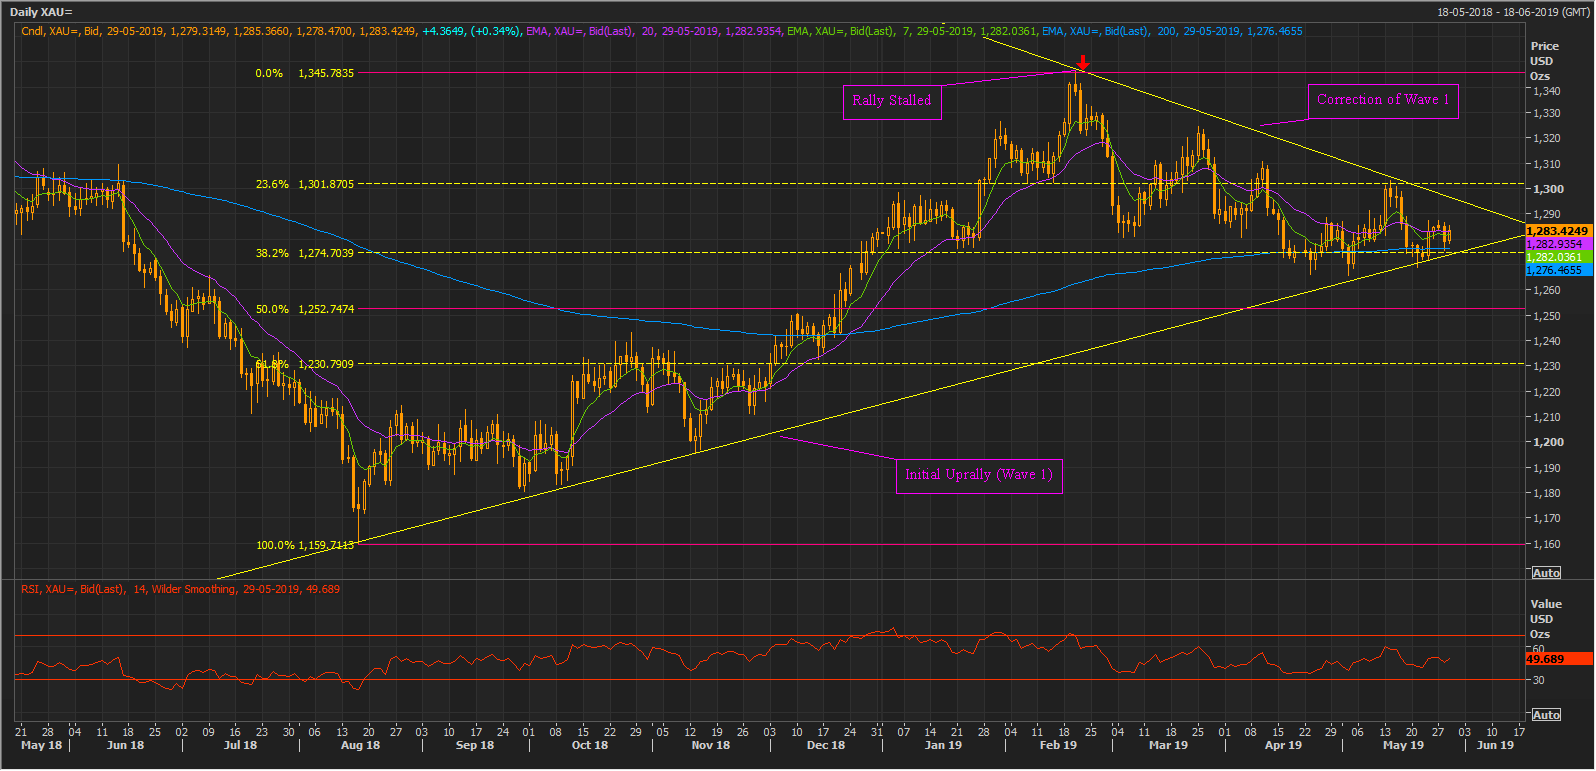 XAU Daily Chart (Source: Thomson Reuters)
On following the development on a daily chart, it can be seen that the prices moved in an uptrend from the level of approx. US$1159.70, marked at the chart as Wave 1. After initially rising to the level of approx. US$1345.80, the initial rally stopped, and the prices started a retracement.
While retracing, the prices tried to take a rebound but faced resistance of the downward sloping yellow trendline on the chart.
In the recent event, the prices are currently taking the support of its 200-day exponential moving average, which is at US$1276.46 and had retraced by more than 38.2% post taking the support of the upward sloping trendline and making a U-turn towards the upside.
The 14-day Relative Strength Index is at 49.689, slightly below its mean value of 50.
Disclaimer
This website is a service of Kalkine Media Pty. Ltd. A.C.N. 629 651 672. The website has been prepared for informational purposes only and is not intended to be used as a complete source of information on any particular company. Kalkine Media does not in any way endorse or recommend individuals, products or services that may be discussed on this site. Our publications are NOT a solicitation or recommendation to buy, sell or hold. We are neither licensed nor qualified to provide investment advice.
