


Technical indicators play an important role in refining and improving the accuracy of the price chart analysis. Indicators are constructed using mathematical calculations, which are based on underlying data like price, volume, volatility etc. The result of this calculation is plotted on the chart in the form of a line/curve which is used to better interpret the unfolding chart pattern.
Domain Holdings Australia Limited (ASX: DHG) is a telecommunications company based in Australia. The company also provides an entire ecosystem of property solutions.
On 30th April 2019, the company released a presentation at the Macquarie Australia conference.
Technical Outlook
Looking simply at the daily chart, the current positive trend could not be denied. Let us have a look at the moving average convergence divergence (MACD) indicator to have a better perspective.
The MACD indicator is based on the convergence and divergence of two moving exponential averages; 12 and 26 periods. The difference between these two-exponential moving average data is plotted consecutively, which creates the MACD line. Whenever the MACD is trading above the baseline (depicting the zero value), the trend is considered to be positive and MACD going below baseline indicates a negative trend.
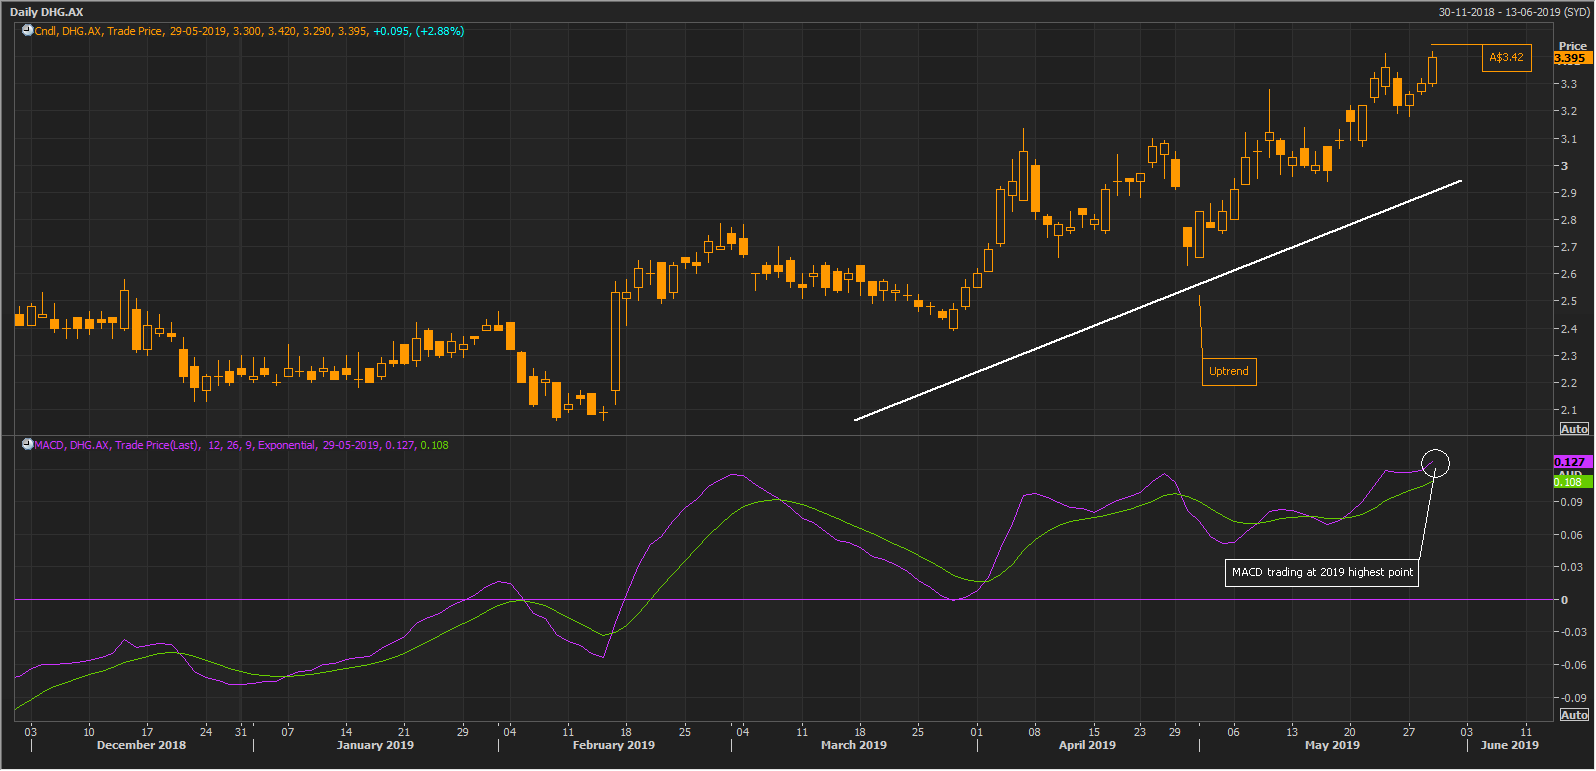 Daily chart of Domain Holdings Australia (Source: Thomson Reuters)
There is also a 9-period exponential moving average plotted on the MACD line for buy and sell signals, but thatâs for trading purpose.
Currently, the stock is trading around A$3.360 as on 29th May 2019, with MACD trading above baseline at 0.127, both the underlying stock price and the indicator are trading at the highest level for 2019. The MACD indicator currently does not indicate any weakness in the stock price trend.
Stock Performance
The company has a market capitalisation of A$1.92 billion, and the stock had touched a 52-week high and low of A$3.64 and A$2.06 respectively. The stock closed the dayâs trade at A$3.360 after making an intraday high of A$3.42 (as on 29th May 2019). The last one-year return of the stock is negative 0.9%, and the YTD return stands at 48.6%.
oOh!media Limited (ASX: OML) is an ASX listed media company working across Australia and New Zealand and creates a deep engagement between clients and their customers through its advertising solutions. The companyâs unparallel reach and engagement influence audiences anytime and anywhere.
On 16th May 2019, the company announced the receiving of all the approvals from its shareholders at its AGM.
Technical Outlook
Since the beginning of 2019, the stock has been trading in a broad range of A$3.36 â A$4.13. The range is so effective that even in the fifth month, the stock is unable to breach the range on either side.
When the stock is trading in a range, the best indicators to look at are the oscillators. These kinds of indicators, as the name suggests, oscillate between a fixed high and low point, very similar to what a stock does in a trading range.
In this case, we have used the Stochastic indicator (oscillator). The stochastic indicator gives an overbought signal when its value is above 80, indicating that the security has risen too high and may undergo price correction or consolidate sideways and undergo time correction.
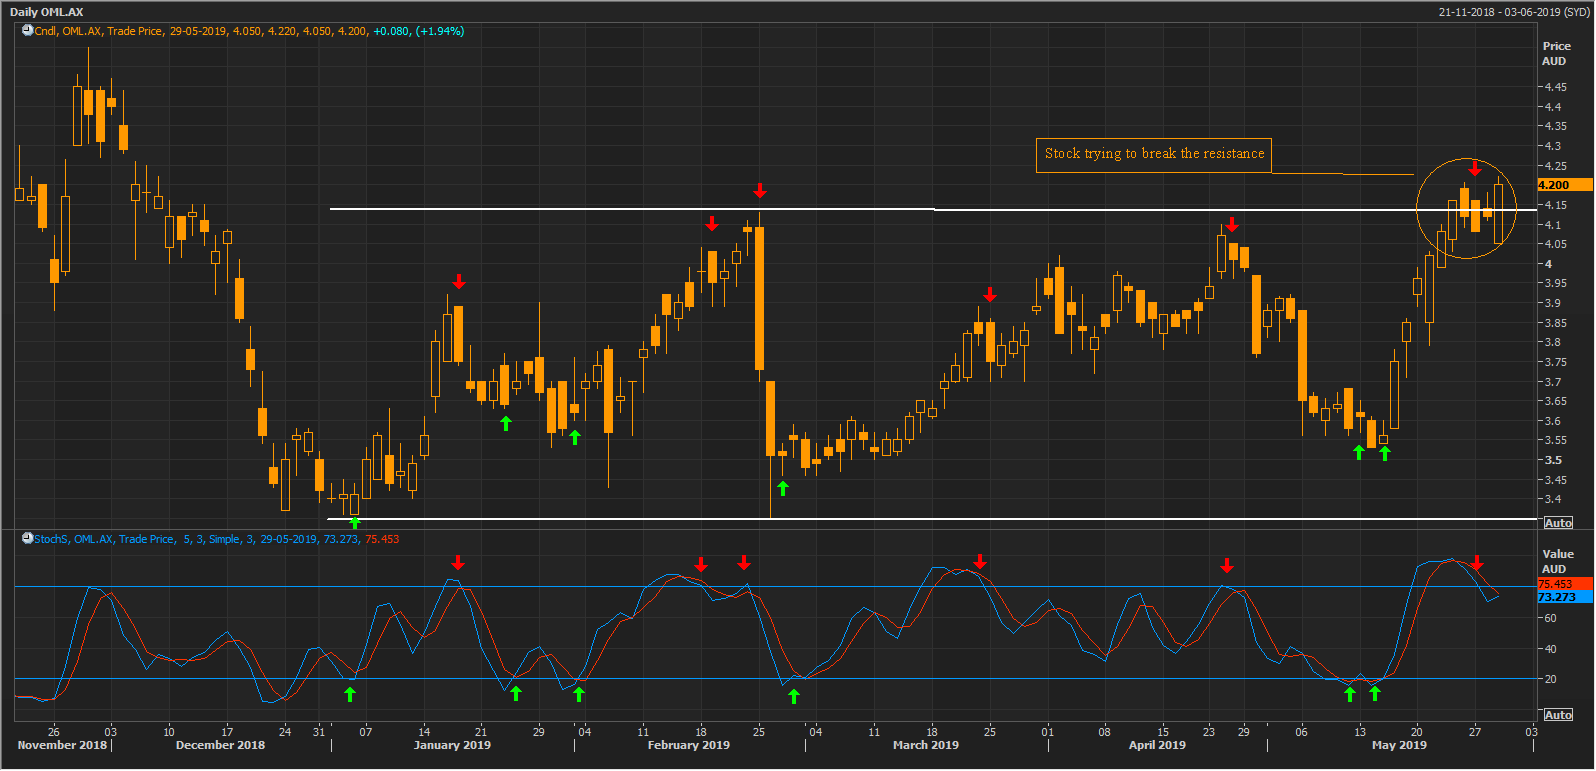 Daily chart of oOh!media (Source: Thomson Reuters)
Similarly, it gives an oversold signal when the value is below 20, indicating that the security has fallen too low and may witness a bounce in price.
As seen on the price chart, the indicator has performed quite well in the entire range (depicted by arrows). If the stock is in the range, the Stochastic indicator is expected to work equally well. In the last couple of days, the stock is trying to break its resistance and had managed to trade above the upper resistance zone, but still hovering around almost the same levels and no strong move is seen as of now.
Stock Performance
The company has a market capitalisation of A$968 million, and the stock had touched a 52-week high and low of A$5.48 and A$3.35 respectively. The stock closed the dayâs trade at A$4.19 after making an intraday high of A$4.22, as on 29th May 2019 (AEST: 1:01 AM). The last one-year return of the stock is negative 17.8%, and the YTD return stands at 21.8%.
Disclaimer
This website is a service of Kalkine Media Pty. Ltd. A.C.N. 629 651 672. The website has been prepared for informational purposes only and is not intended to be used as a complete source of information on any particular company. Kalkine Media does not in any way endorse or recommend individuals, products or services that may be discussed on this site. Our publications are NOT a solicitation or recommendation to buy, sell or hold. We are neither licensed nor qualified to provide investment advice.
