


Gold prices in Australia are leveraging the falling domestic currency amid the strengthening dollar prices. The gold spot in Australia soared from the level of A$1768.68 (Dayâs low on 18th April 2019) to the level of A$2067.94 (Dayâs high on 25th June 2019), a 16.9 per cent one-way relentless rally.
Gold prices were mainly supported by the falling Australian Dollar prices, which fell from the level of US$0.7206 (Dayâs high on 17th April 2019) to the level of A$0.6830 (Dayâs low on 18th June 2019).
Gold Industry Outlook:
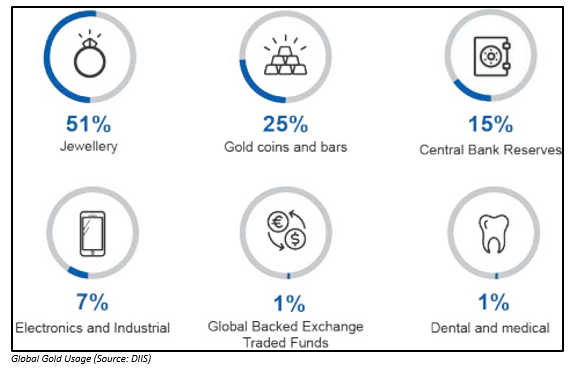
Australia is the second largest gold producer in the globe, and the country produced 315 tonnes of gold in 2018, which accounted for 9 per cent of the world mine gold supplied in 2018. Gold is substantially used in Jewelleries with 51 per cent share, while gold coins and bar account for 25 per cent of global gold usage.
The gold prices rallied over the geopolitical tensions in the global market, and the Australian Department of Industry, Innovation and Science (or DIIS) predicts that the gold prices are likely to rally to US$1,440 per ounce in 2021.
The higher estimated prices for gold could boost the Australian export figures as the DIIS estimates the gold export volume would reach 370 tonnes in 2020-21, up by 12 per cent from the previous corresponding period.
The DIIS forecasted that the value of exported gold from Australia would reach the level of $22 billion in 2020-21 over expected rise in gold prices, production and export volumes.
Gold Demand and Supply Dynamics:
Demand Scenario:
The overall global demand for gold surged by 7.0 per cent on a yearly basis in March 2019 quarter and stood at 1,053 tonnes amid high buying from the central banks to hedge against previously rising dollar prices.
Gold ETFs also marked a massive inflow in the March 2019 quarter, and recently the gold-linked instruments surged in Europe to counter the slowdown in the Eurozone. As per the data, Gold-backed ETF holdings witnessed a global inflow over 40 tonnes or US$1.9 billion in the March 2019 quarter, which in turn, marked an increase of 48 per cent on a yearly basis.
In March 2019 quarter, the official buying stood at 145 tonnes, which in turn, underpinned an increase of 68 per cent on a yearly basis. The recent March quarter buying also denoted the highest volume of March quarter net purchase since the year 2013.
The Australian Department of Industry, Innovation and Science forecasts the gold demand to grow with an average annual rate of 3.1 per cent on a yearly basis in 2019 and 2020. The DIIS further predicts that the global demand would peak to 4,728 tonnes in 2020; however, the demand is projected to decline, post the 2020 peak by 4.9 per cent to stand at 4,497 tonnes.
The rise is demand is estimated to be supported by the buying from central banks, and as per the data, the buying from central banks is likely to be over 700 tonnes by 2020 and is forecasted by the DIIS to grow by 4.3 per cent yearly in 2019 and 2020.
Post the 2020 peak, which is estimated to be at 711 tonnes in 2020; the central banks buying would likely to decrease by 10 per cent to 640 tonnes in 2021 amid expected improvement in global tensions.
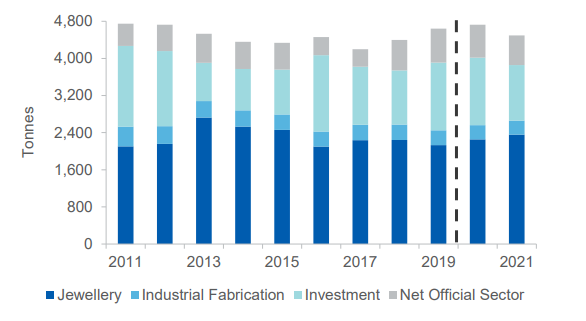
World Gold Consumption (Source: DIIS)
Supply Scenario:
The global supply declined by 0.3 per cent in the March 2019 quarter and stood at 1,150 tonnes amid fall in net hedging, which as per the data, decreased by 72 per cent on a yearly basis. However, the mine production inched up by 1.1 per cent on a yearly basis in March 2019 quarter to stand at 852 tonnes.
Australia being the second largest producer, contributed substantially in the global production, and Australiaâs gold output rose by 6.2 per cent on a yearly basis during the March 2019 quarter.
The Australian Department of Industry, Innovation and Science forecasts that the global supply would witness an average annual decline of 1.6 per cent between 2019 and 2021, which in turn, would take the overall global production to 4,437 tonnes in 2021.
The global mine production is likely to mark a decline from the level of 3,399 tonnes in 2019 to 3,202 tonnes in 2021, as the long established project would reach the end of life.
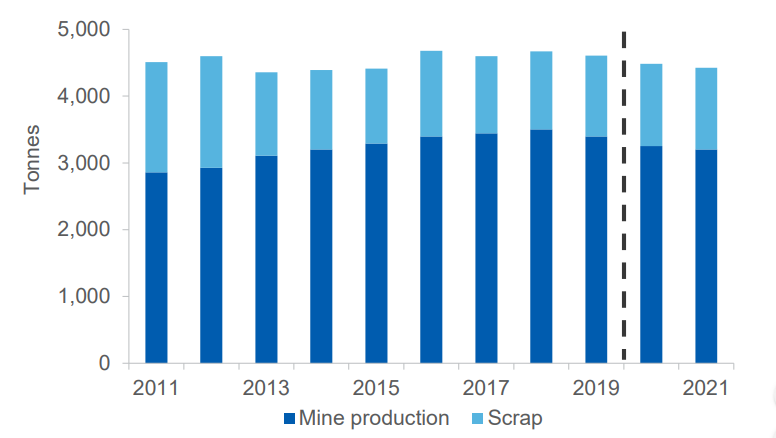
World Gold Production (Source: DIIS)
The Australian Angle:
The exploration expenditure in Australia increased by 17 per cent on a yearly basis in March 2019 quarter and stood at $220 million; the higher gold prices prompt the Australian miners to inch up the exploration activity to take advantage of high commodity prices.
Australian Gold production:
The overall production in the country witnessed an increase of 6.2 per cent on a yearly basis in March 2019 quarter and stood at 77 tonnes. The DIIS forecasts Australian production to peak at 339 tonnes in 2019-20. However, the output is anticipated to fall to 332 tonnes in 2020-21.
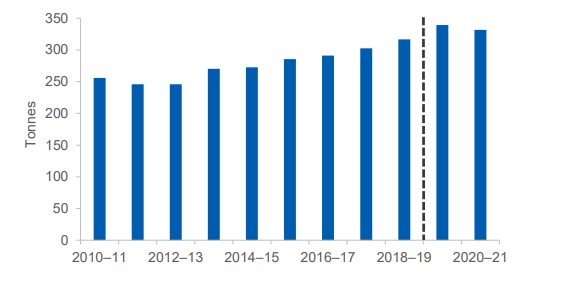
Australia Gold Production (Source: DIIS)
The following would present the summary of the overall global and Australian production, price, and volumes.
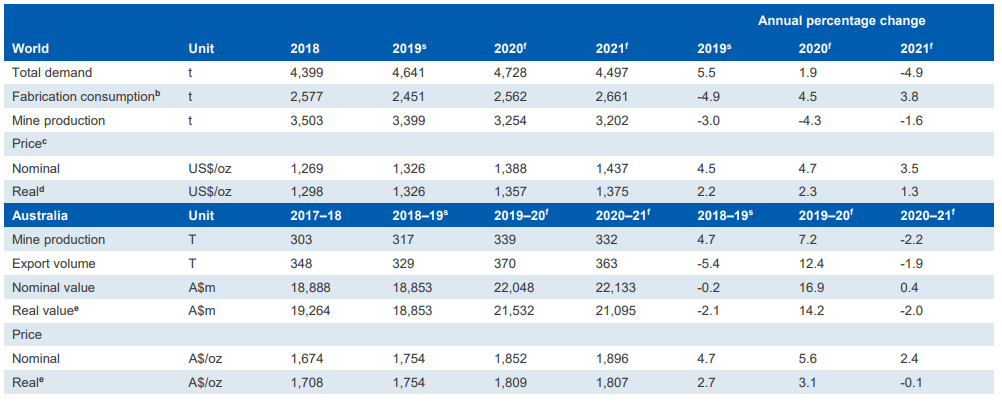
Source: DIIS
Post understanding the overall gold industry outlook and Australiaâs production and price forecast. Let us now take a look over the ASX-listed gold miners.
ASX-Listed Gold Miners:
Evolution Mining Limited (ASX: EVN)
EVN is an ASX-listed gold explorer and producer, which holds significant projects such as Mt Carlton, Mt Rawdon, Edna May, Cowal, etc. The company maintains and operates seven gold mines in Western Australian, the region, which accounted for a substantial portion in Australian gold production and exploration expenditure in 2018.
Latest Update:
EVN presented its preceding financial year 2019 operating results and future guidance for the financial year 2020.
In June 2019 quarter, EVN produced 194,866 ounces of gold, up by over 10 per cent, when compared to its previous quarter production of 175,901 ounces. The company witnessed a decline in All-in Sustaining cost (AISC), which stood at A$915 per ounce, down by over 1 per cent from its previous quarter AISC of A$925 per ounce.
The operating mine cash flow inched up to A$217.4 million in June 2019 quarter from the level of A$168.3 million in the previous quarter. The operating mine cash flow witnessed a single period growth of over 29 per cent.
The Net mine cash flow also inched up to A$154.4 million, up by over 43 per cent, when compared to its previous quarter net mine cash flow of A$107.8 million.
FY 2019 Highlights:
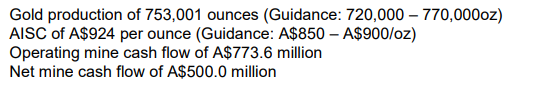
Source: Companyâs Report
FY 2020 Guidance:
The group forecasted the gold production in the range of 725,000-775,000 ounces in FY 2020, with an AISC of A$890-A$940 per ounce.
Post assuming the forex exchange rate of US$0.7156 per AUD for the 12 months to 30th June 2019, EVN estimates that FY20 cost would be the lowest of global gold producers. The company estimates the cost to be in the range of US$635-US$670 per ounce.
Dacian Gold Limited (ASX: DCN)
DCN, the Australia based mineral explorer presented its FY 2020 guidance on 10th July 2019.
In the update, DCN mentioned that the updated Life-of-mine (LOM) delivers the company an average annual production 170,000 ounces of gold over the first five years with an estimated AISC of A$1,340-A$1,440 per ounce.
As per the company, the total gold production over the 8-years LOM from FY2020-FY2027 would stand at 1.1 million ounces with an AISC of A$1,280-A$1,380 per ounce, and the consolidated All-in cost over the eight-year LOM would be in the range from A$1,330-A$1,430 per ounce.
The 8-year LOM plan for Mt Morgans Gold Operation is as:
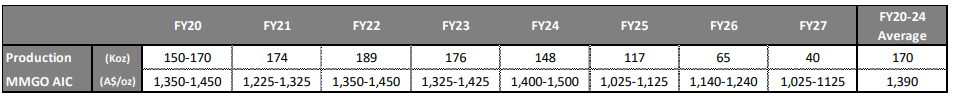
Source: Companyâs Report
FY 2020 Guidance:
DCN kept the production guidance in the range of 150,000-170,000 ounces at the Mt Morgans Gold operation with an All-in-Cost at A$1,400-A$1,500 per ounce.
Ramelius Resources Limited (ASX: RMS)
RMS is engaged in the gold exploration, mine development, production and sales along with its subsidiaries.
Latest Update:
RMS presented its June 2019 quarter production report on 10th July 2019, in which the company mentioned the group June 2019 quarter production stood at 47,342 ounces of gold, which is in line with the companyâs guidance of 45,000-50,000 ounces of gold.
On the operations counter, Mt Magnet produced 18,913 ounces of gold; while the production at Vivien prospect stood at 11,757 ounces of gold and the production at the Edna May stood at 16,672 ounces.
The overall FY 2019 production of the company stood at 196,679 ounces of gold, which was also within the companyâs guidance of 190,000-210,000 ounces.
At the end of the June 2019 quarter, the cash and gold on hand stood at A$106.8 million, which was slightly up as compared to the previous quarter cash and gold of A$104.7 million. However, the A$106.8 million figures include the recent expenditure on the exploration of A$4.9 million and A$23.3 million in asset acquisition and project development.
The forward gold sales as on 30th June stands 240,900 ounces with an average price of A$1,834 per ounce over the period to August 2021.
Cygnus Gold Limited (ASX: CY5)
CY5 or formerly Craton Gold Pty Ltd is an ASX-listed gold explorer in Australia. The company focuses on the exploration of high-grade gold deposits in Western Australia.
Latest Update:
In an announcement made public by the company on 10th July 2019, CY5 mentioned that the company recommenced drilling at Lake Grace JV, with Gold Road Resources Limited (ASX: GOR).
As per the company, a program of up to 77 aircore holes, which would account for ~ 3000m is underway for the Hammerhead prospect. The company intersected arsenic anomalism at the target GC01, and the drilling results for the target are as:
Drill hole identified as LGAC0019 intersected 1m @ 0.15g/t of gold from 52m.
Drill hole identified as LGAC0022 intersected 1m @ 0.12g/t of gold from 11m.
The Hammerhead prospect of the company is a high priority target and CY5 mentions that a follow up aircore drilling program of 77 holes is now spaced to 400-800m lines, which extends to the north and south of the original GC01 drilling.
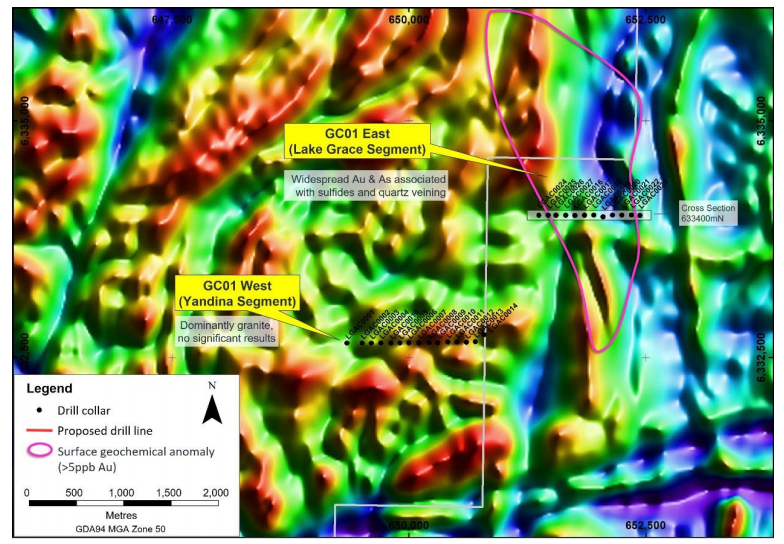
GC01 outline of surface gold anomalism (Source: Companyâs Report)
While few miners are focusing on exploration to encash the high estimated demand and the price upside, some gold miners on the Australian Securities Exchange have reacted quickly over bull run in gold on 10th July.
On 10th July 2019, gold prices recovered from its recent bottom of US$1386.26 (Dayâs low on 9th July 2019) to the high of US$1422.59, which in turn, supported the share prices of the ASX-listed gold miners, and many famous names marked a gap up opening and a sharp upside.
Resolute Mining Limited (ASX: RSG)
The shares of the company marked a gap up opening today on ASX and started the dayâs session at 1.442, up by over 4 per cent from its previous close. The recent gold rally has brought the stock to a new 52-week high of A$1.525 (as on 11th July 2019, AEST: 2:22 PM).
The stock is currently trading at A$1.525, up 10.108% as compared to its previous close (as on 11th July 2019, AEST: 2:22 PM).
Newcrest Mining Limited (ASX: NCM)
NCMâs shares started the dayâs session at A$32.020, up by over 1.6 per cent from its previous close of A$31.490. The sudden recovery in gold supported the stock, and the stock took a U-turn from its recent bottom of A$31.090 (Dayâs low on 9th July).
Presently, the stock of the company is moving again towards its recently established 52-week high of A$32.740 (High on 25th June 2019).
The stock is currently trading at A$32.120, up by 2% as compared to its previous close (as on 11th July 2019, AEST: 2:24 PM).
Saracen Mineral Holdings Limited (ASX: SAR)
SARâs shares followed the same trajectory and marked its footsteps towards the upside. The stock started the dayâs session at A$3.750, up by over 3.50 per cent from its previous close of A$3.620. The shares of the company remained the star of the recent gold rush and marked the highest positive percentage change in the opening price.
The stock is currently trading at A$3.755, up by 3.729% as compared to its previous close (as on 11th July 2019, AEST 2:25 PM).
Disclaimer
This website is a service of Kalkine Media Pty. Ltd. A.C.N. 629 651 672. The website has been prepared for informational purposes only and is not intended to be used as a complete source of information on any particular company. Kalkine Media does not in any way endorse or recommend individuals, products or services that may be discussed on this site. Our publications are NOT a solicitation or recommendation to buy, sell or hold. We are neither licensed nor qualified to provide investment advice.
