


Gold prices are hustling in the international market in the absence of any price sensitive event; the prices previously rose after the president of the United States Donal Trump raised the tariffs on the Chinese goods (worth $200 billion) from 10 to 25 per cent, and China retaliated on the same.
However, in the current event, gold spot prices are hustling to cross the previous month high of US$1310.6. The direction of gold in future is becoming a paradox among the market participants. In the absence of any further global macro-driver, the yellow metalâs shine is under question, and the safe haven is plunging from last three trading sessions.
The closer look at the price action on different time frames could possibly hint towards the future movement of the prices.
Technical Outlook:
 Source: Thomson Reuters: Gold Spot Monthly Chart
On carefully observing the monthly chart, we can see that the gold prices initially rose with the initial wave marked as (0). The initial wave rose till the level of US$1375.23 in July 2016, and post marking the high, the first wave of correction marked as (1) took it to the level of A$1122.73 (low in December 2016).
The prices again gained the momentum and the second wave marked as (2) led to a high of US1366.47 in January 2018. However, the prices were unable to breach the level of US$1375.23 made in July 2016, and the prices again plunged to the level of US$1160.34 (low in August 2018), from where the central bank buying pushed the prices till the level of US$1346.79 in February 2019.
However, the momentum gain was unable to breach the previous high of U$1366.47. The continuous failure of gold to breach the level of US$1375.23 led the gold prices consolidate in the range as shown in the chart.
Post addressing the long-term trend in gold prices, let us now focus on the shorter frame to reckon the short-outlook for gold.
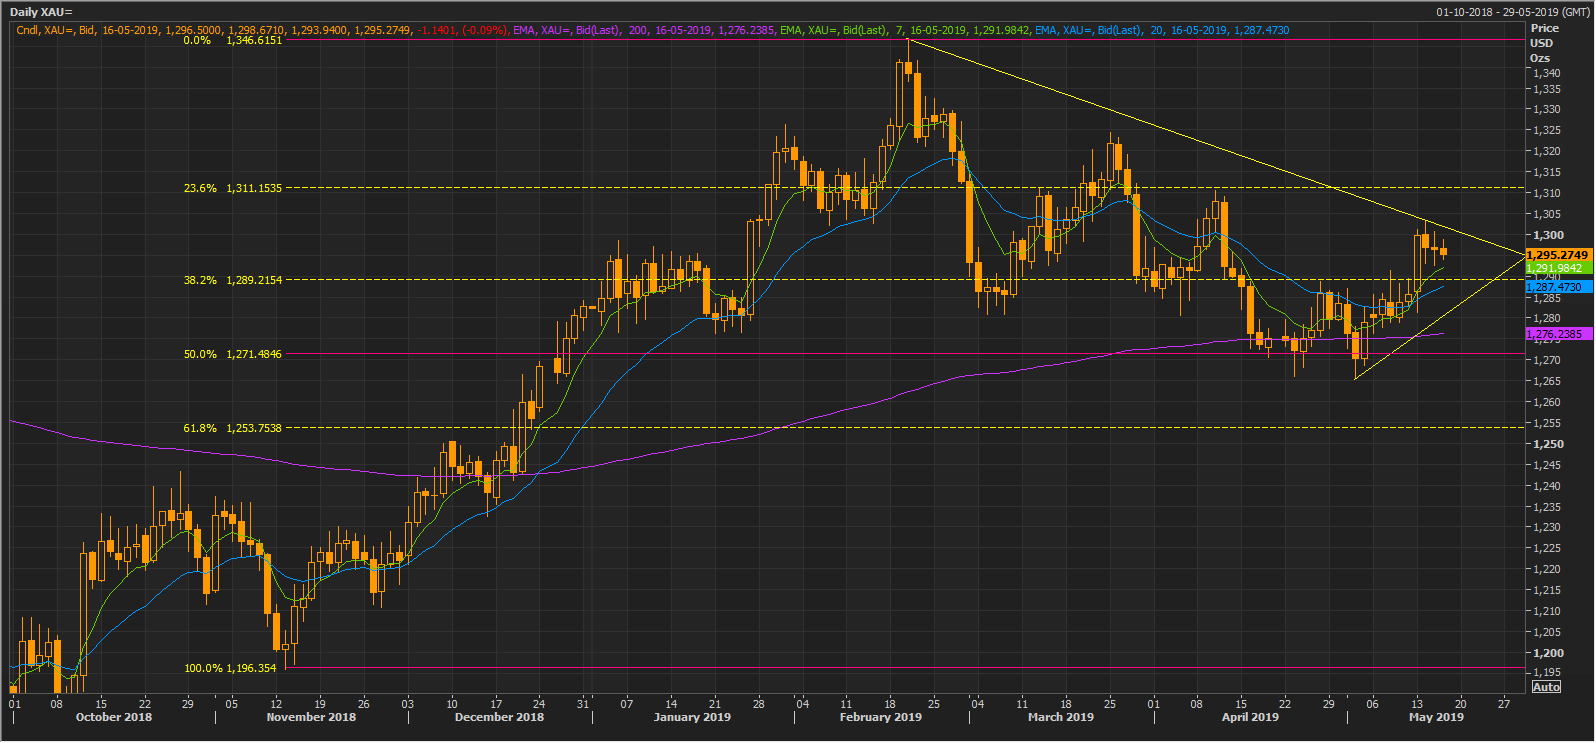 Source: Thomson Reuters: Gold Spot Daily Chart
However, the recent rally in gold narrowing down the downward sloping triangle (made by connecting highs and lows on the chart), and a breakout above or below this triangle could establish a long-term trend for the gold prices.
Upon studying the developments on a daily chart, it can be seen that the gold prices are trading above its 7, 20,200-days exponential moving averages (EMAs), which are currently at US$1291.98, US$1287.47, and US$1276.23.
The moving average recently established a golden cross over (bullish signal) of 7 and 20 days EMA, seen on the chart by the crossing of green line from below the blue line. Gold prices retraced almost 50% in value for the top US$1346.79, before again staring a short-term uptrend. However, the slope of resistance is downward, which, in turn, could offer resistance to gold prices in the near future. However, investors should keep a close eye on the economic development and the U.S-China trade front to gauge the gold potential to either breach the downward sloping trendline or retraces back.
Disclaimer
This website is a service of Kalkine Media Pty. Ltd. A.C.N. 629 651 672. The website has been prepared for informational purposes only and is not intended to be used as a complete source of information on any particular company. Kalkine Media does not in any way endorse or recommend individuals, products or services that may be discussed on this site. Our publications are NOT a solicitation or recommendation to buy, sell or hold. We are neither licensed nor qualified to provide investment advice.
