


The international commodity market is in a beleaguer from the recently escalated U.S-China bilateral disagreement dispute, which is dragging down the prices of risky assets in the market. The prices of various commodities such as crude oil, base metals, etc., are dropping in the market. The other risky assets such as equities are also experiencing panic across the globe over the possible global economic slowdown.
The uncertainty in the global market and diminishing return from other assets is underpinning the gold demand, which in turn, is supporting the gold prices.
However, the factor which provided a catalyst to the gold prices to rise from the level of $1160.34, seen in August 2018, has been the demand push by the central bank during the first quarter of the year 2019. The central bank of China, Russia, etc., inched up their gold purchase to reduce exposure to the volatility in dollar price.
The dollar index dropped in January 2019, which in turn, supported the gold prices in the same month.
After a significant increase to the level of $1346.79 (February 2019), Gold spot faced the dollar leverage and prices dropped till $1266.43 in April.
After such a substantial increase in prices, the gold dropped over progressive U.S-China trade talks from March 2019 till April 2019. However, the re-escalation of the U.S-China trade war supported the gold prices in May 2019, and the prices resumed its original upward trend.
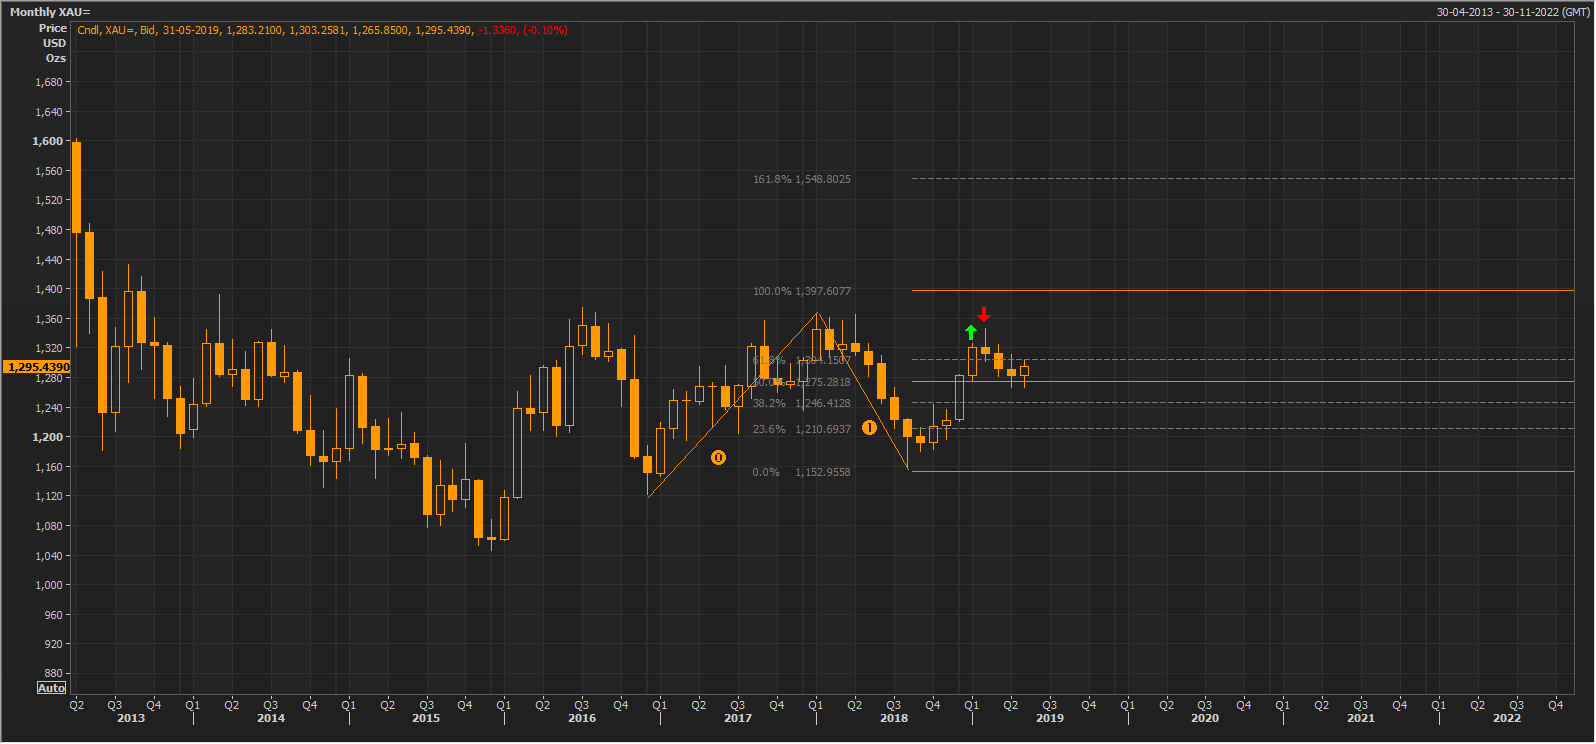 Source: Thomson Reuters; Gold Spot Monthly Chart
On following the development on a monthly chart, it can be seen that the gold started its first rally marked as (0) in the chart, and the second wave, marked as (1) ended around $1160. The gold resumed the uptrend after that and corrected till the level of $1266.43 in April.
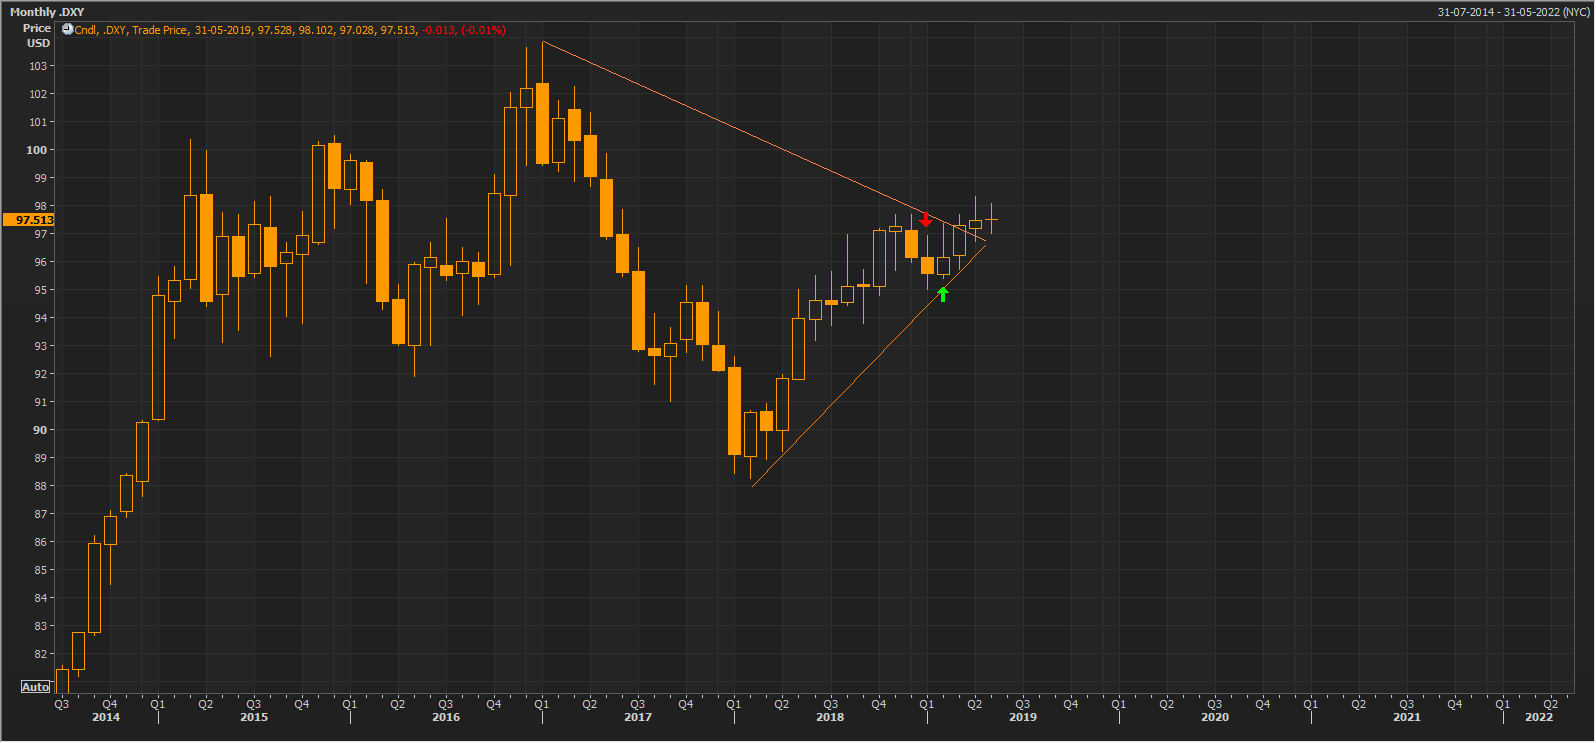 Source: Thomson Reuters; Dollar Index (DXY) Monthly Chart
The down arrow (red) in the dollar index and up arrow (green) on the gold spot chart compliments each other.
First Quarter Gold Demand:
As per the data from the World Gold Council, the world jewellery demand marked an increase of 1% in the first quarter of the year 2019 and stood at 530.3 tonnes, as compared to 527.3 tonnes in the previous corresponding period.
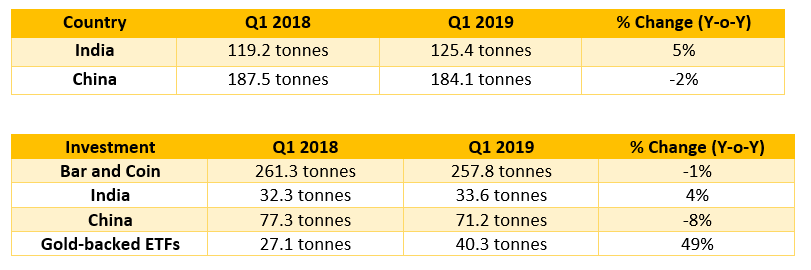 The Gold-backed ETFs marked the highest increase in demand and pushed the total investment demand up by 3% in the first quarter of the year 2019. The demand for Q1 2019 stood at 298.1 tonnes, as compared to 288.4 tonnes in the previous corresponding period.
Central banks buying to reduce the dollar exposure increased the demand substantially by 68%, and the demand stood at 145.5 tonnes in the first quarter of the year 2019, as compared to just 86.7 tonnes in the previous corresponding period.
On the supply side, the total supply reduced to 1,150.0 tonnes in the first quarter of the year 2019; however, the supply marked no substantial change. The supply for the Q1 2018 stood at 1,153.1 tonnes.
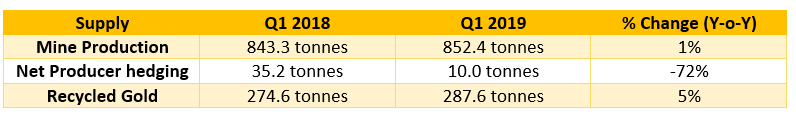 The high prices of gold prompted miners to increase the production level to take advantage of high gold prices in the global market.
Disclaimer
This website is a service of Kalkine Media Pty. Ltd. A.C.N. 629 651 672. The website has been prepared for informational purposes only and is not intended to be used as a complete source of information on any particular company. Kalkine Media does not in any way endorse or recommend individuals, products or services that may be discussed on this site. Our publications are NOT a solicitation or recommendation to buy, sell or hold. We are neither licensed nor qualified to provide investment advice.
