


In this article, we would be discussing five stocks operating in different sectors. These stocks have recently posted their results for the period ended 30 June 2019. Letâs have a look at the yearly financial figures of these companies.
1st Group Limited
1st Group Limited (ASX : 1ST) is a digital health group listed on the ASX in 2015. The company offers a range of value-added apps and services, facilitating digital patient and customer engagement. Its integrated platforms offer access to online search and appointment booking services. The company operates through three portals, MyHealth1st.com.au, PetYeti.com.au and GoBookings.com.
FY19 Highlights: On 28 August 2019, 1st Group Limited announced a market update regarding its performance during FY19, a successful year for the company, which posted revenue at $3.95 million, up ~15.3% y-o-y and bottom line at ($4.339) million as compared to ($4.636) million in FY18. Cash and cash equivalents at the end of the reported year stood at $2.772 million. Intangibles were valued at $3.462 million. The company reported borrowings at $1.835 million while net assets stood at $3.130 million.
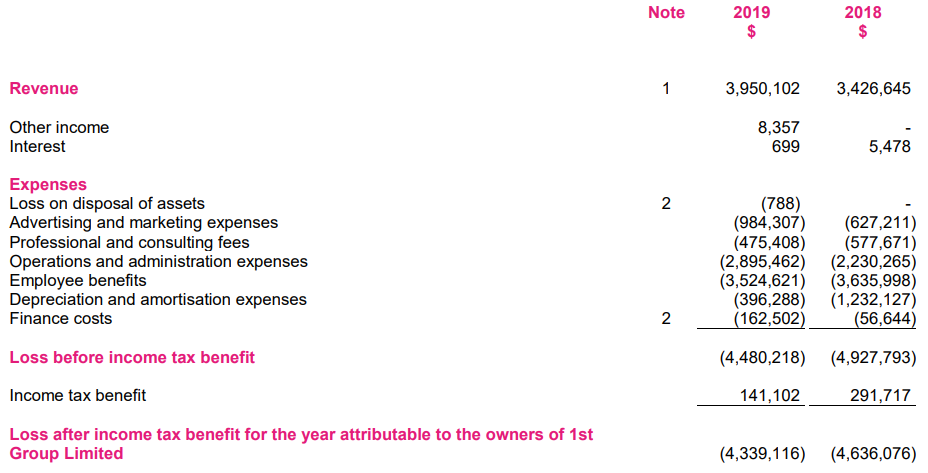
FY19 Financial highlights (Source: Company Reports)
The company crossed the 9.7 million bookings mark during the year, as sites reported an increase of 35%. Annualised Contract Value (ACV) of subscription fees was up by 26.6% (y-o-y) during the year, while additional site revenues (setup, usage and advertising fees) reported a rise of 26% y-o-y. During the year, the company signed contracts with Benestar, St Vincentâs Health and Medibank.
Outlook: As per the management guidance, recurring subscription revenues for H1FY20 are estimated at $5.75 million - $6.45 million. The company also expects additional site revenues other than ACV, to grow materially during the first half of FY2020.
Stock Update: On 28 August 2019, the stock of 1st Group closed the dayâs trading at $0.065, down by 13.333% from its previous close. The 52-week trading range of the stock stands between $0.024 and $0.110. The stock has generated healthy returns of 56.25% and 150% in the last three months and six months, respectively. The market capitalisation of the stock is $26.65 million with approximately 355.39 million outstanding shares.
RMA Global Limited
RMA Global Limited (ASX : RMY) is engaged in the online digital marketing business. The company provides extensive data on residential property sale results to real estate agents and agencies. Moreover, RMY provides reviews agent performance from vendors and buyers of residential real estate. The company is active across the markets of Australia, New Zealand and the United States.
FY19 Results: In a press release dated 28 August 2019, RMY reported its FY19 results, unveiling 19% growth (y-o-y) in revenue at $7.31 million and a net loss after tax at $(7.244) million against a net loss of $(2,504) million during FY18. EBITDA during the period stood at $(7.306) million. The company reported a cash balance of $3.694 million and net assets at $2.883 million as on 30 June 2019.
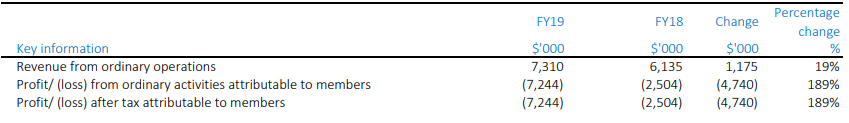
FY19 Financial highlights (Source: Company reports)
Business Performance: The Australian segment reported subscription revenues at $6 million, up 17.5% y-o-y followed by 28.3% jump in total reviews from the Australia segment. The company reported âpromoter revenueâ at $0.976 million in Australia. House sale volume was lower by 17.4% across major cities of Australia. Active agents with a claimed profile stood at 21,800 in Australia and 25,200 in the US.
Outlook: The management plans to focus on significantly growing the infrastructure and agent network in the US and New Zealand. The company is actively looking to expand its footprints across new geographies.
Stock Update: On 28 August 2019, RMY closed the dayâs trading at $0.250, with no change from its previous closing. The market capitalisation of the stock stands at $92 million along with 368 million outstanding shares. The stock of RMY has generated healthy returns of 25% and 21.95% in the last three months and six- months, respectively.
Raiz Invest Limited
Raiz Invest Limited (ASX : RZI) provides financial services and related products through mobile-based micro-investing platform which offers a convenient way for investors to invest any amount by using the Raiz mobile application or through the Raiz website in Australia.
FY19 Results: During FY19, RZI reported revenue at $6.227 million, up from $2.761 million in FY18 and a loss of $7.147 million against a loss of $7.198 million in FY18. The groupâs cash balance stood at $6.815 million at the end of the year, while intangibles were valued at $20.669 million. The company reported net assets at $26.457 million as on 30 June 2019.
Operating Performance: Active users during the year increased by 21% to 194,360, while revenue from micro-investing platform grew 72% y-o-y. Revenue per active customer grew by ~42%, while ~74% growth was reported in funds under management to $347 million. Average account balances grew by 24% to $1,544. RZIâs super accounts stood at 1,944 while investment from this segment came at $48 million. Raiz had tied up with bundll, a Flexigroup product to provide digital payment options for its customers. Payment options include buy now pay later, instalments options along with a market-leading product suite.

Source: Companyâs Report
Outlook: The management is expecting to register continued revenue growth in FY20, aided by fee increase from 1 August 2019. The companyâs business in Indonesia is expected to add revenue from Q2FY20, while the Malaysian business is anticipated to made revenue additions in Q4FY20.
Stock Update: On 28 August 2019, the stock of RZI closed trading at $0.955 up by 0.526% from its previous close. The 52-week trading range of the stock stood at $0.420 to $1.060, and currently, RZI is trading at the upper band of its 52-week trading range. The stock ha generated positive returns of 106.52% and 39.71% in the last 3 months and 6 months, respectively.
Objective Corporation Limited
Objective Corporation Limited (ASX: OCL) is engaged in the supply of information technology software and services.
FY19 Results: The company posted FY19 revenue at $62.1 million, down 2% y-o-y while net profit after tax came at $9.1 million, higher by 23% y-o-y. EBITDA, during the year, stood at $14.1 million while R&D expense during the year stood at $13.2 million against $13.1 million in FY18.
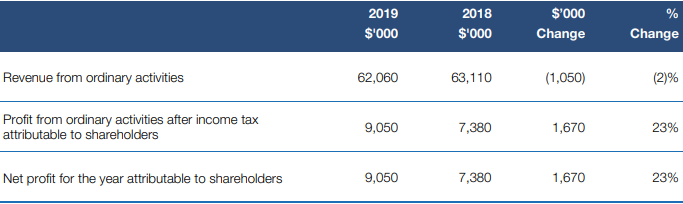
(Source: Company reports)
Dividend Announcement: The board announced a fully frank dividend of AUD 0.0500 along with a special unfrank dividend of AUD0.0100 against each ordinary share held. Payment of the dividend will be made on 16 September 2019 while the OCL announced the record date at 9 September 2019.
Outlook: The management expects material growth in revenue and profitability during FY20. The company would invest in its existing product portfolio and emphasise on new products through acquisitions where strategically aligned.
Stock Update: OCL closed the dayâs trading at $3.210 on 28 August 2019, with no change from its previous close. The stock has given positive returns of ~10.69% and ~16.30% in the last three months and six months, respectively. The annualised dividend yield of the stock stands at 1.56%. At current market price, the stock is available at a price to earnings multiple of 43.38x.
Donaco International Limited
Donaco International Limited (ASX : DNA) is engaged in operating leisure and entertainment businesses across the Asia-Pacific region. The company has operations like Star Vegas Resort and Club, which is in Cambodia and Aristo international Hotel in Vietnam.
FY19 Financial Figures: In FY19, DNA posted group revenue at $86.3 million, down from $92.606 million and posted Statutory NPAT at $(194) million versus $(124.5) million in FY18. EBITDA during FY19 stood at $29.6 million as compared $42.4 million in the previous year.
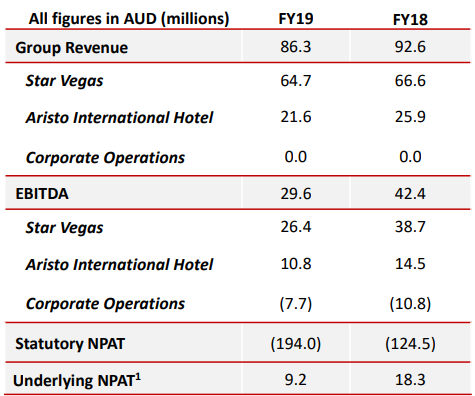
(Source: Company reports)
Operating Performance: The management cited that Star Vegas was negatively impacted by competition from the nearby Winsor, Paramax and the new Galaxy casinos. Star Vegas operated at a lower VIP win rate of 2.69%, vs 2.85% theoretical win rate of 3.00% in y-o-y terms. Income from Aristo was impacted due to lower visitation during July-August 2018. Significant improvement was witnessed in the June 2019 quarter, with 17.5k average monthly visitors (13.2k in pcp) and Aristo win rate of 2.09% (1.91% in pcp).
Outlook: The company expects its new management to come up with initiatives aimed at both venues - Star Vegas and Aristo - to deliver higher returns during FY20.
Stock Update: The stock of DNA closed trading at $0.073 on 28 August 2019, with no change from the previous day trading. DNA has a market capitalisation of $60.12 million and approximately 823.59 million shares outstanding. DNA has generated mixed returns of -9.88 % and 4.29 % in last three months and six months, respectively.
Disclaimer
This website is a service of Kalkine Media Pty. Ltd. A.C.N. 629 651 672. The website has been prepared for informational purposes only and is not intended to be used as a complete source of information on any particular company. Kalkine Media does not in any way endorse or recommend individuals, products or services that may be discussed on this site. Our publications are NOT a solicitation or recommendation to buy, sell or hold. We are neither licensed nor qualified to provide investment advice.
