


Dominoâs Pizza Enterprises Limited (ASX: DMP) is a well-known and the largest pizza chain in Australia while considering the network store numbers and sales. The company operates its own retail outlets as well as gives out franchise service with master franchise rights with a vast network spread across Australia.
Dominoâs is one such stock that has given exponential returns to its long-term shareholders, and the stock was quoting A$2.5 â A$2.8 a share at the beginning of 2009 and the stock witnessed an exponential growth and surged massively to top at A$80.69 in August 2016. Thatâs a massive return of more than 3000%+.
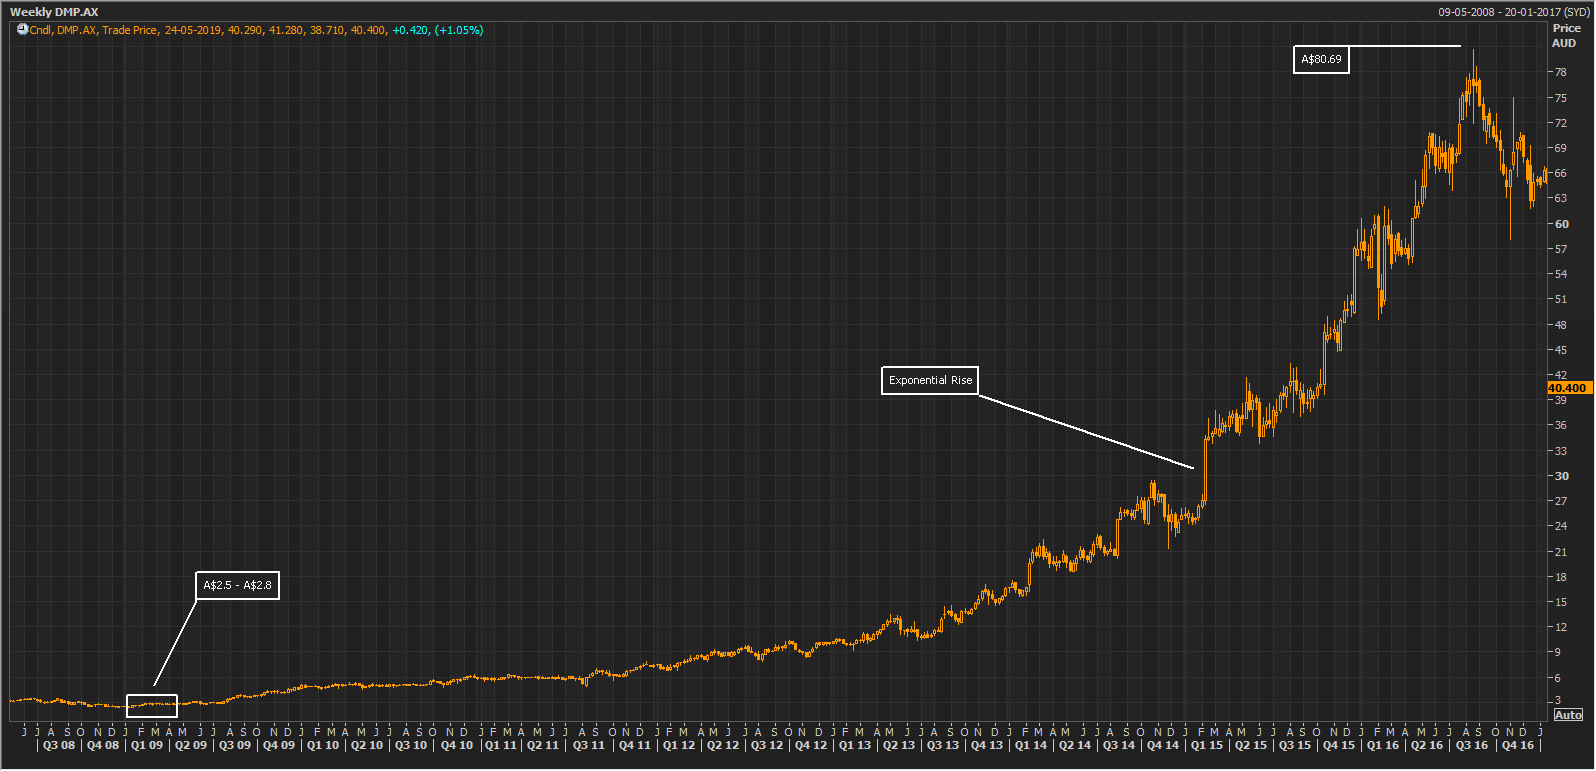 Weekly chart of Dominoâs Pizza (Source: Thomson Reuters)
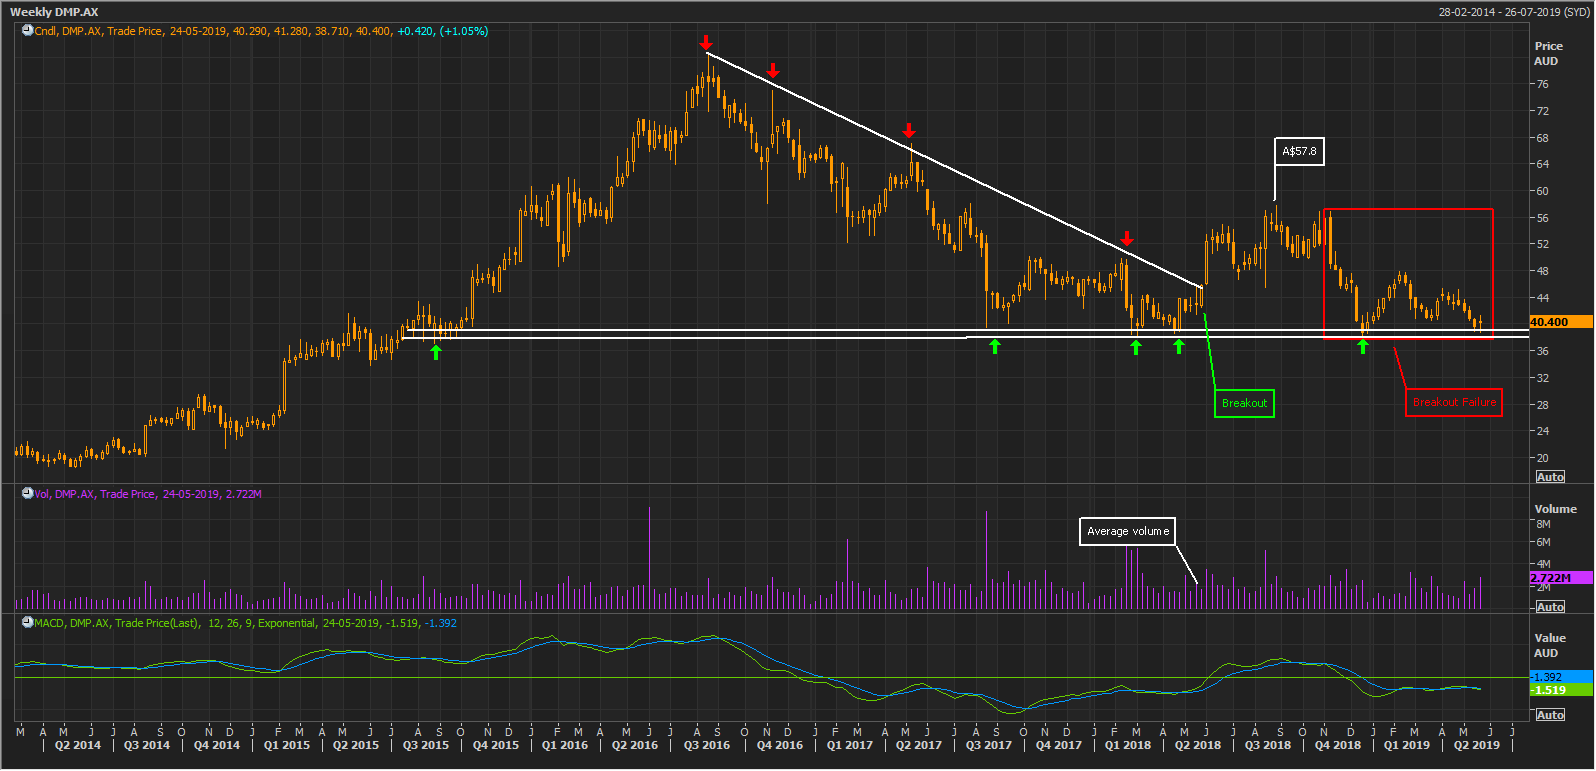
Post the August 2016 top; the stock started to decline. In due course of the price correction, the stock had continuously tested its upper downward tapering trendline and was unable to breach it. In a falling market or stock price scenario, the upper trendline acts as a resistance level, and the selling pressure is expected whenever the stock trades near the trendline. This was witnessed multiple times as can be seen in the chart below, and the stock dived back to the lower levels after hitting the trendline.
 Weekly chart of Dominoâs Pizza (Source: Thomson Reuters)
This downtrend continued till May 2018, and in the same month, the stock broke above its upper trendline (above A$45.5) with an average volume of ~1.67 million shares. This was the first indication that the breakout could fail going forward, as the breakout was not supported by an above average volume. After the breakout, the stock rallied till A$57.8 but soon fell sharply to the lows made in the previous correction from the top, that also meant the stock was also below the breakout level and resulted in a breakout failure.
On the weekly chart, the stock has a strong support level of A$38 â A$39, which had constantly been tested since July 2015. Every time the support had been tested, the stocked reversed from these levels. Currently, the stock is trading around A$40.4 and is very close to its support, but the trend seems more to be on a negative side, which creates an alternate view of whether this time the stock would be able to hold its support level or not.
The negative trend has been depicted by moving average convergence divergence (MACD) indicator, which depicts the current trend of the security. The value of MACD is derived from the difference between 12 and 26-day moving average, higher value depicts a positive trend, and lower value depicts negative trend, based on these moving averages.
As of 24th May 2019, MACD was showing a value of negative 1.51, which depicts the current trend to negative. Additionally, the nearby presence of strong support zone is a classic dilemma for the traders and, further, to add to this dilemma the MACD is making a bullish divergence pattern as compared to the weekly price chart action. The upcoming price action would be keenly tracked to make further assumptions given the current chart setup.
Dominoâs has a market capitalisation of A$3.46 billion, and the stock had touched a 52-week high and low of A$57.8 and A$38.1 respectively. The stock is currently trading at A$40.610 on ASX (as at AEST: 1:17 PM, 27 May 2019), up by 0.52%. In the last one-year the stock has returned negative 9.34%, and the YTD return stands at negative 0.74%.
Disclaimer
This website is a service of Kalkine Media Pty. Ltd. A.C.N. 629 651 672. The website has been prepared for informational purposes only and is not intended to be used as a complete source of information on any particular company. Kalkine Media does not in any way endorse or recommend individuals, products or services that may be discussed on this site. Our publications are NOT a solicitation or recommendation to buy, sell or hold. We are neither licensed nor qualified to provide investment advice.
