


The bilateral trade dispute between the United States and China is now dampening, which along with a additional production cut of 0.5 million barrels a day from the OPEC members and higher imports from the United States is supporting crude oil prices in the market.
The Crude oil futures (January 2020 expiry) surged from USD 56.15 (Low on 3 October 2019) to the present high of USD 68.33 (High on 27 December 2019) a barrel, which underpinned a price appreciation of approx. 21.70 per cent.
Also Read: Crude Ripples From OPEC Production Cut Despite EIA’s Lower Price Forecast
OPEC took the overall production cut to 1.7 million barrels a day for 2020, which many experts believe that OPEC would carry for the entire coming year. However, the recent comments from the Russian Energy Minister-Alexander Novak indicated that Russia would not support the longer production cut to maintain the market share.
Also read: OPEC to hold 177th annual meet; Russia the potential game changer?
The crude oil market reacted sharply post the comment, and the crude oil prices witnessed an intraday fall of approx. 1.90 per cent at the opening session (on 30 December 2019) against its previous day close of USD 68.16 per barrel.
However, the trend in oil remained positive over the higher import and lower exports of oil from the United States in the short-term. The long-term trend in the oil market is somewhat confusing over the ambivalent demand and supply dynamics.
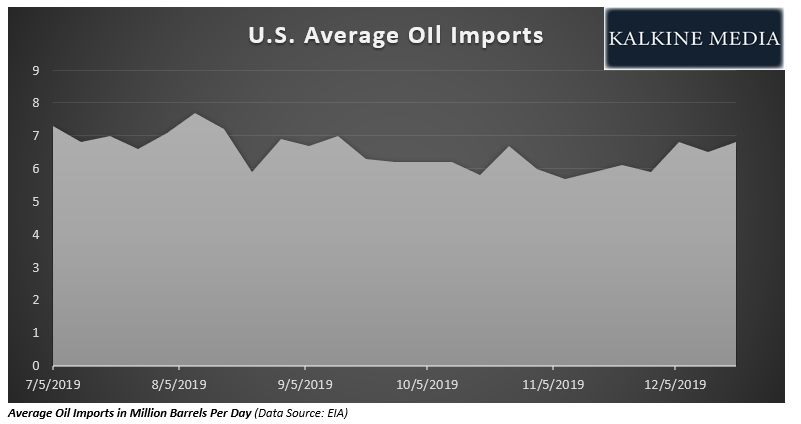
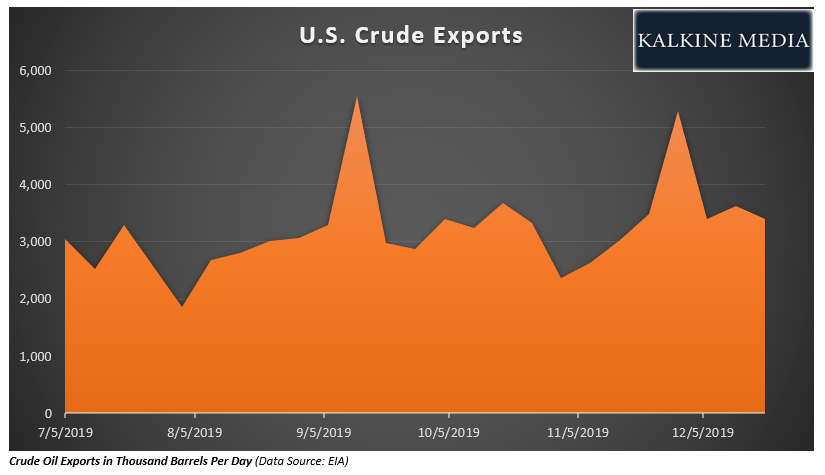
Higher Import, Lower Exports, and Steady Production in the United States
The weekly imports in the United States surged by ~5 per cent for the week ended 20 December 2019 by 0.3 million barrels a day to stand at 6.8 million barrels a day against its previous week import of 6.5 million barrels a day.
The higher export coupled with lower imports suggested improving demand in the United States, which in turn, provided an impetus to the crude oil prices.
The weekly crude oil exports from the United States declined by 6.50 per cent for the week ended 20 December 2019 to stand at approx. 3.4 million barrels a day against its previous week export of 3.6 million barrels a day.
The crude oil imports observed an increase despite steady domestic oil production, which also witnessed a slight increase. The weekly crude oil domestic production in the United States surged again to stand at 12,900 thousand barrels a day for the week ended 20 December 2019.
Is Crude Deriving Value from Demand? Or Supply?
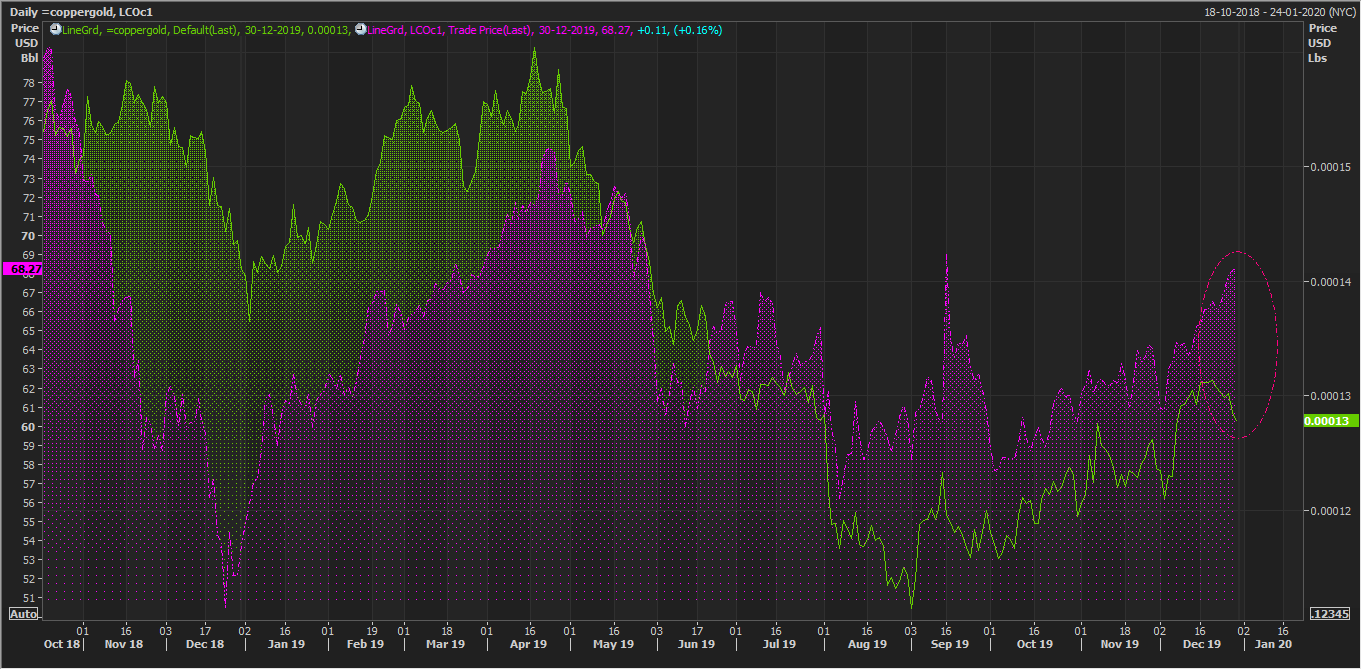 LCO and Copper-to-Gold Daily Chart (Source: Thomson Reuters)
· The weekly petroleum figures reflected that the demand for crude oil improved slightly in the United States over the recent past week.
· Apart from that, the recent dampening in the bilateral trade dispute is also supporting crude oil prices by improving the market sentiment.
· However, on comparing crude oil prices with the copper-to-gold ratio, which usually reflects market sentiments over the global economic conditions, we could observe discrepancies, which further reflects that in the short-run the crude oil prices are not being driven by the demand sentiments.
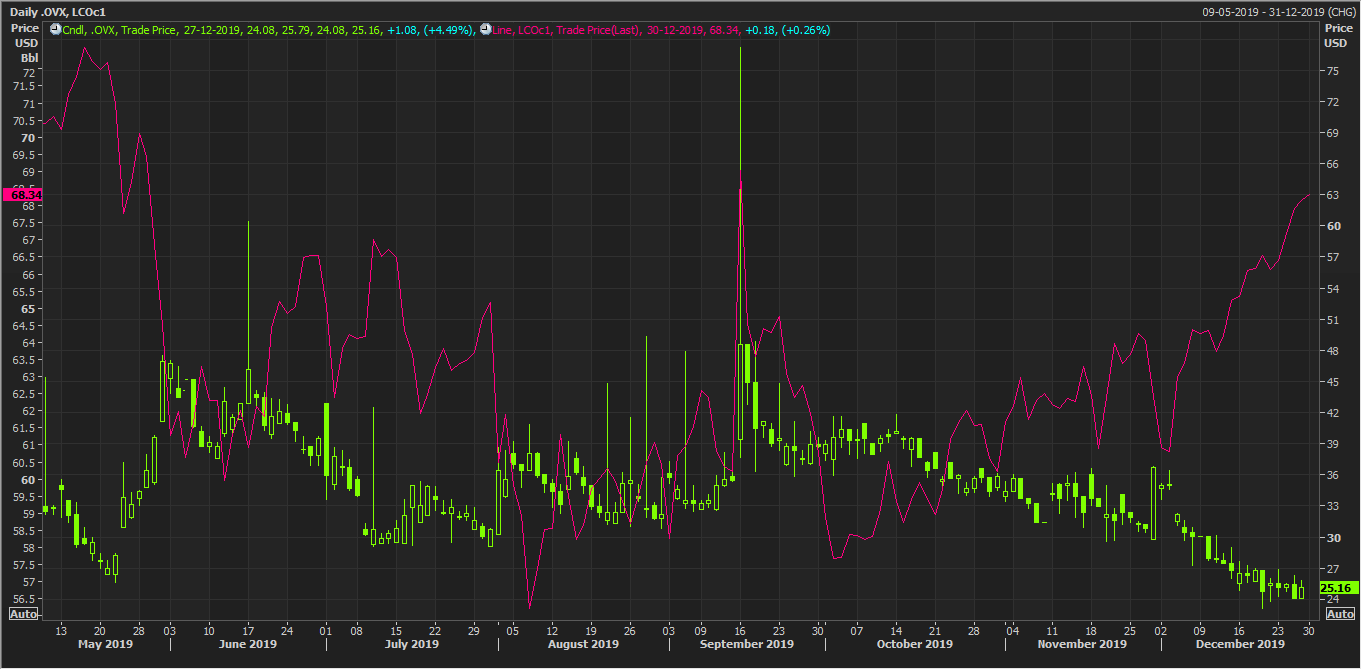 OVX and LCO Daily Chart (Source: Thomson Reuters)
The opposite direction in crude oil prices and implied volatility is suggesting that market is also not concerned about the crude oil supply as well, which at the current moment would be unnecessary to consider, as many price forecasters such as EIA have already forecasted an oil supply glut in the coming future amid higher production anticipation from the non-OPEC oil producing countries.
The above studies indicate that crude oil prices are not deriving its price from either demand or supply; however, the copper-to-gold ratio generally assumes that gold prices rise only when the economic conditions are gloomy.
While the above-stated assumption is true in many cases it is not mandatory; thus, the above study might not reflect all the facts and is just the standard industry-accepted correlations, and investors should dig out for more such correlations before coming to a conclusion.
Also Read: EIA Forecasts On The Brent Crude Oil; Crude Oil Prices Likely To Be Demand-Driven Ahead?
Crude Oil on Charts
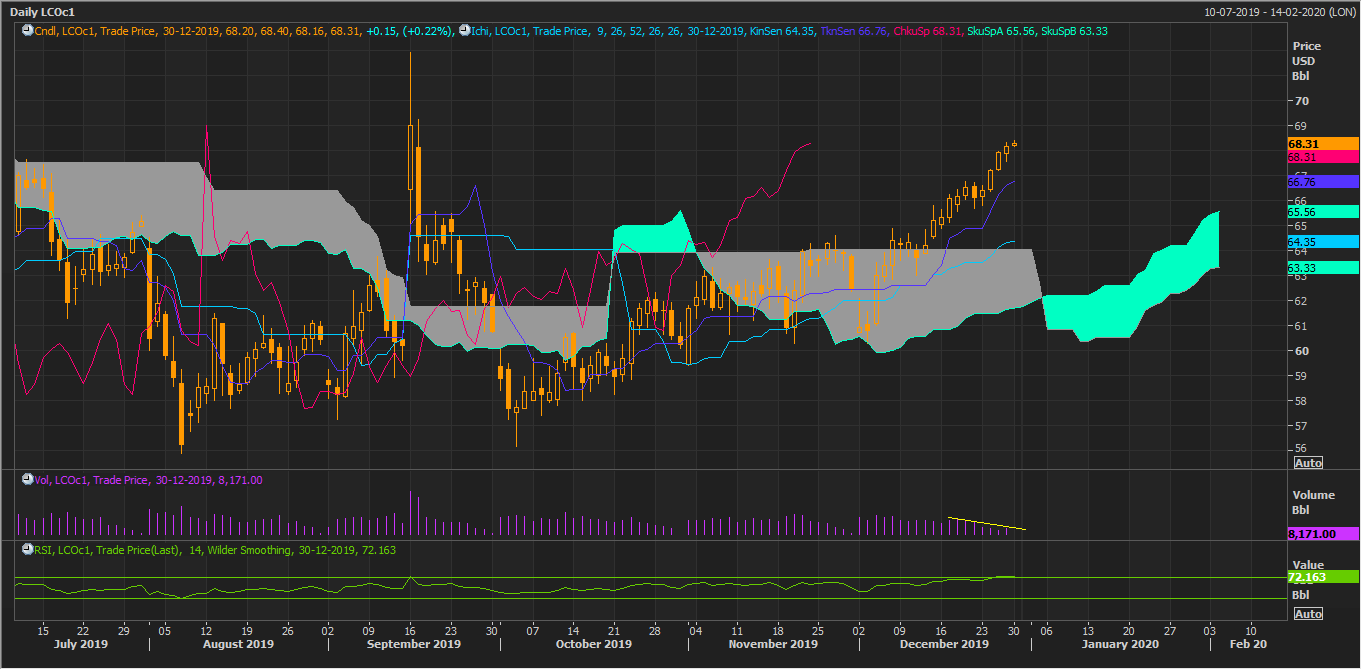 LCO Daily Chart (Source: Thomson Reuters)
On the daily chart, crude oil is trading above Span A of the Ichimoku cloud, which represents the mean between the conversion line (mean of 9-day high and low) and base line (mean of 26-day high and low). However, the spread between Span A and Span B (mean of 52-day high and low) is narrowing down, which suggests that the uptrend is losing momentum.
The indication from the Ichimoku clouding technique is further supported by the declining trend in volume, along with the presence of the 14-day Relative Strength Index in the overbought zone.
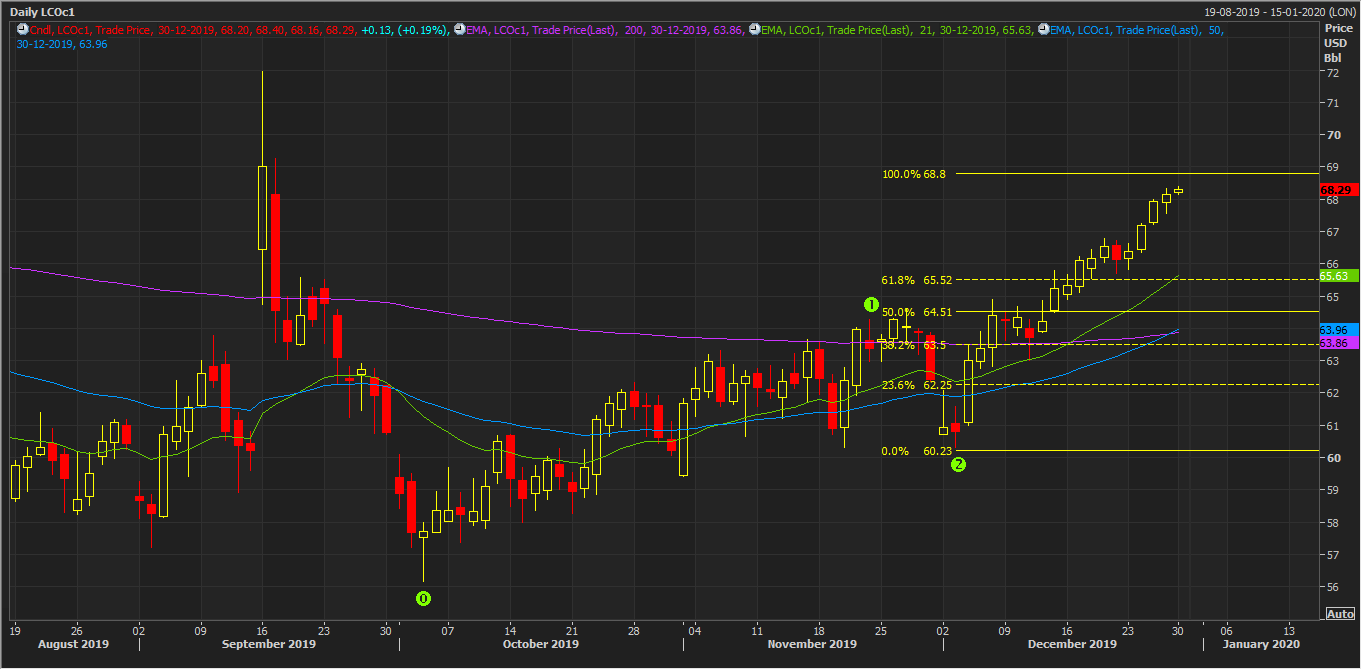 LCO Daily Chart (Source: Thomson Reuters)
The prices are currently trading above the 200-day exponential moving average (USD 63.86) with 21-day exponential moving average crossing both 200-day EMA and 50-day EMA; however, the positive cross between 200-day EMA and 50-day EMA is yet to occur, and a break above and sustain 100.0 per cent projected level (Fibonacci) with decent volume would further support the prices, while failure to do so would have an opposite impact.
On projecting the Fibonacci series from the recent high and low points, marked as 0,1, and 2, we witness that the prices could face a strong hurdle at the 100.0 per cent projected level, which usually serves as a point of strong resistance once the prices complete the projections below 100.0 per cent such as 61.8 per cent, 50.0 per cent, 38.2 per cent, and 28.6 per cent.
Crude is setting up for an interesting short-term price action, as indicated by the mixed correlations as described above. On this backdrop the Crude price watchers are entering 2020 on a cautious note, considering the recent up move in prices driven more by speculations or technical reasons as against structural.
Disclaimer
This website is a service of Kalkine Media Pty. Ltd. A.C.N. 629 651 672. The website has been prepared for informational purposes only and is not intended to be used as a complete source of information on any particular company. Kalkine Media does not in any way endorse or recommend individuals, products or services that may be discussed on this site. Our publications are NOT a solicitation or recommendation to buy, sell or hold. We are neither licensed nor qualified to provide investment advice.
