


The S&P/ASX 200 financials index is witnessing some recovery in the market; however, many industry experts are closely monitoring the uptick in the index, as the index is surging with lower volumes.
In this article we study the S&P/ASX 200 financials index to reckon the price behaviour of the financial sector, which by weight, is the largest contributor to the S&P/ASX 200 index. We would also touch upon some of the blue chips, which are among the top contributors in the S&P/ASX 200 Financial index by market capitalisation.
Suggested Read: S&P 500 and Dow Jones Poised for More Losses? Gauging Future Movement Via Technical Tools
S&P 500 Financials Index (XFJ)
- XFJ on a monthly chart
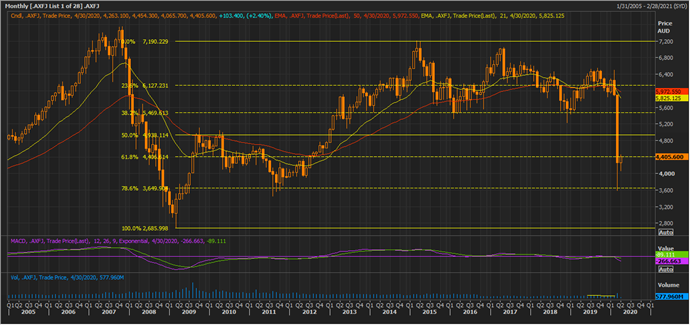
S&P/ASX 200 financials index on a monthly chart (Source: Thomson Reuters)
On the monthly chart, it could be seen that the index has retraced over 61.8 per cent of the primary up rally, which started from the level of ~ 2,685.99 to end at the top of ~ 7,190.22. Post retracing by 61.8 per cent of the primary rally the index is showing some recovery; however, the volume is not following the recovery and is considerably less against the spiked volume seen during the fall in the previous month.
The index is still trading with a negative crossover between the 50-month exponential moving average and 21-month exponential moving average (EMA), suggesting that the current trend is a downtrend. The moving average convergence and divergence or MACD indicator is also showing a negative crossover on the monthly time frame, which coupled with comparatively less volume against the previous month candle could raise further eyebrows.
- XFJ on a weekly chart
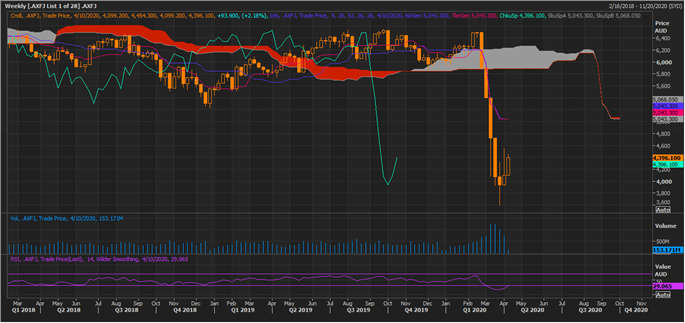
S&P/ASX 200 financials index on a weekly chart (Source: Thomson Reuters)
On the weekly chart, the index is trading below Span B (mean of 52-week high and low) of the Ichimoku cloud with a negative crossover between the conversion line (pink line)- which represents the mean value of 9-week high and low, and the base line (dark blue)- which represents the mean value of 26-week high and low, suggesting that price actions are currently being dominated by bears.
The 14-week relative strength index is also below its mean value, and volumes are not in tandem with the price action, i.e., not increasing as the price shows some recovery.
However, the spread between Span B and Span A (mean value of the conversion line and the base line) is narrowing down due to the recovery in price, suggesting a halt in current fall. On the weekly time frame, the primary resistance for the index would be around the grey cloud zone, and a break & sustain above the same with decent volume should be considered as an early sign of the change in current trend, while the support could be at the recent low of 3,591.20, break below which could resume the current downtrend.
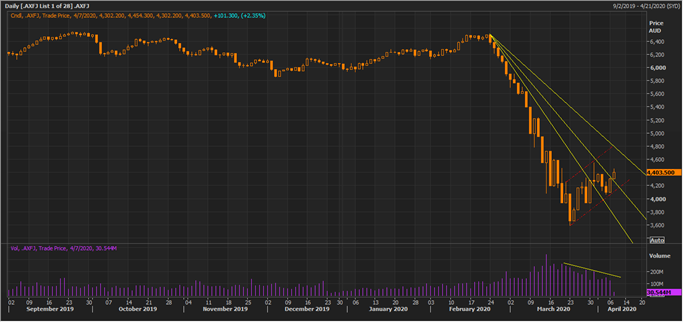
- XFJ on a daily chart
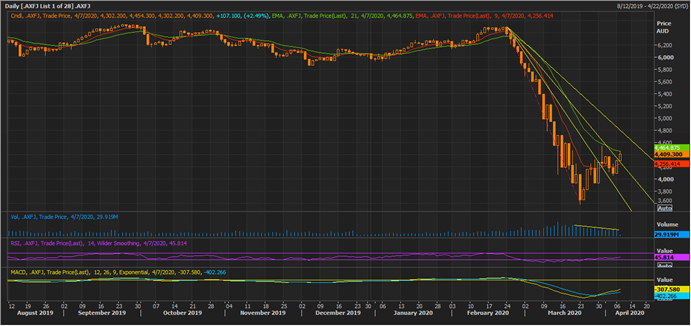
S&P/ASX 200 financials index on a daily chart (Source: Thomson Reuters)
On the daily chart, the index is showing some recovery from its recent low with a positive signal from the MACD; however, the volume is not in tandem. The index is currently trading above the second line of the Fibonacci fan, projected by connecting the recent high to the recent low, and is also testing the 21-day EMA. The major resistance on the daily timeframe is at the third projected line of the Fibonacci fan, a point which is showing some interesting developments.
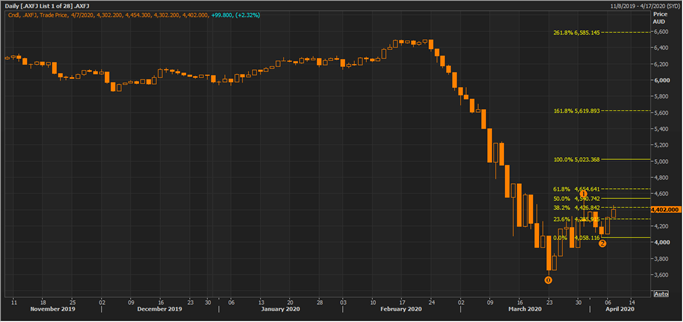
S&P/ASX 200 financials index on a daily chart (Source: Thomson Reuters)
The approximate resistance level suggested by the Fibonacci fan is around the 100.0 per cent level of Fibonacci projections, where the current recovery is anticipated to exhaust. Each resistance level suggested by Fibonacci projections is the possible near-term zone, where the price can hover or say resistance zones. The 100.0 per cent projected level, is coinciding with resistance zone as indicated by the Fibonacci fan.
S&P/ASX 200 financials index on a daily chart (Source: Thomson Reuters)
Another interesting point at the suggested resistance zones by the Fibonacci series of fan and projections is that the same zones would be the point where the current price pattern, which is a potential bearish flag pattern, would confirm its formation. If the index falls from the suggested zones to breach the lower end of the potential bearish flag (lower red line), it could be seen as the continuation of the current trend.
How Are the Heavy Weights of the Index Poised?
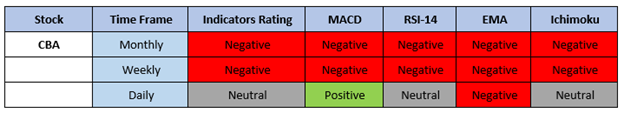
- Commonwealth Bank of Australia (ASX:CBA)
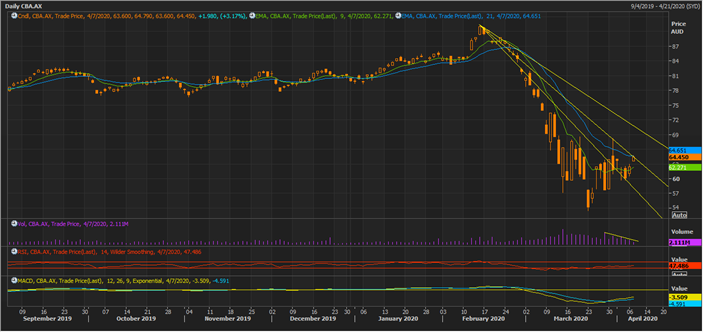
CBA Daily Chart (Source: Thomson Reuters)
The stock is mimicking the price behaviour of the index, and is rising with tapering volumes, and is currently testing the second line or resistance line of the Fibonacci fan. The MACD is showing a positive signal; however, the 14-day RSI is still below its mean value.
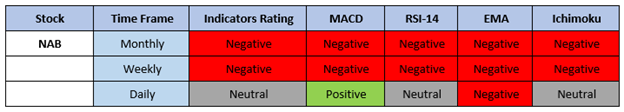
- National Bank of Australia (ASX:NAB)
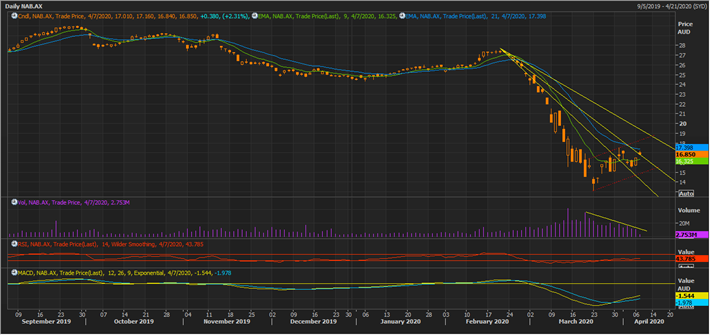
NAB Daily Chart (Source: Thomson Reuters)
The stock is following the footsteps of the overall index and is showing somewhat the same price behaviour, calling for the same studies. NAB is on a rise with tapering volumes, and the resistance levels could be seen on the above chart. Also, the stock is showing a potential bearish flag, which is pending confirmation and should be monitored closely around the third resistance line of the Fibonacci fan.
- Afterpay Limited (ASX:APT)
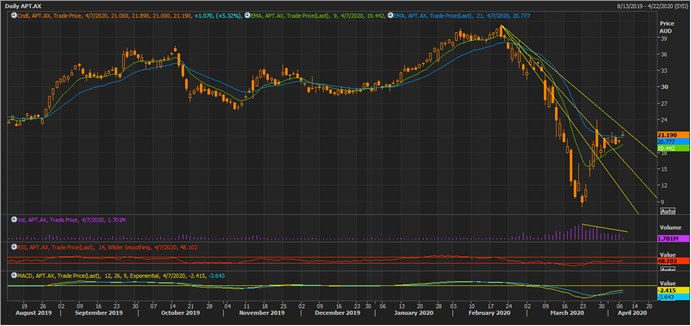
APT Daily Chart (Source: Thomson Reuters)
APT is on a rise with tapering volumes and is moving to test the third resistance level. Also, the 21-day and 9-day EMAs are converging, and APT is now trading above both the EMAs. All eyes are on the charts as the stock as it on the verge of testing the final short-term projected resistance.
