


Summary
- Shares of Afterpay Touch Group Limited (ASX:APT) have been under a consistent rally for quite some time and have provided a price appreciation of over fivefold from the recent low.
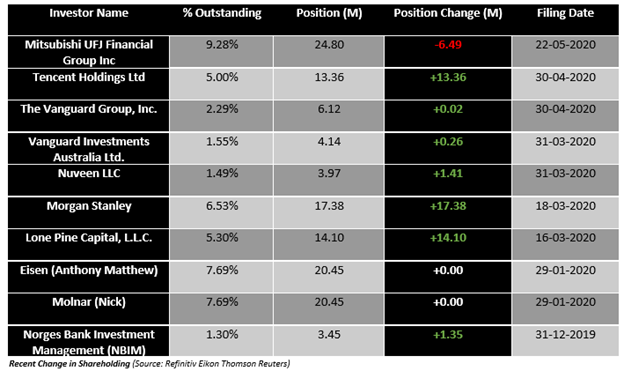
- In the status quo, the stock has reached its all-time high of $50.01; however, has witnessed an offloading of shares by Mitsubishi UFJ Financial Group, Inc.
- After the recent offloading, the stock has demonstrated slight bearish signals, which one should be aware of while navigating APT, whose major and primary trend yet remains strong and up.
Afterpay Touch Group Limited (ASX:APT) has gained strong momentum in the market with the stock demonstrating consistent rally on the exchange from the level of $8.01 (intraday low on 23 March 2020) to the high of $50.01 (intraday high on 26 May 2020), which represent a price gain of ~ 525 per cent.
In the status quo, the Company has backlashed on the coalition of consumer groups urging the federal government to regulate the Company and others in the buy now pay later services as small credit companies offering traditional loans.
However, APT has now backlashed against the consumer group seeking regulation of the buy now pay later services as traditional loans, and in a submission to a senate committee, the Company has cited that the current focus of regulatory authorities on financial stability in the wake of COVID-19 outbreak should push the dominance of big banks.
Apart from that, APT also suggested to the senate that consumer outcomes should be the key focus as compared to the one-size-fits-all regulatory approach.
While the Company might be facing some headwinds amidst consumer groups seeking regulation of the buy now pay later services as traditional loans, the market seems to be liking the stock, inferred from the recent rally in the stock, which took it to a record high of $50.01.
However, while the price action has been strong until now, the stock has witnessed a session of a decline during the trading session on 27 May 2020 post the Company disclosed a change in the shareholding of the Mitsubishi UFJ Financial Group, Inc., which offloaded $205.88 million worth of shares (6.49 million shares).
APT on Charts
- APT Daily Chart Analysis

APT Daily Chart (Source: EODHD/Others Eikon Thomson Reuters)
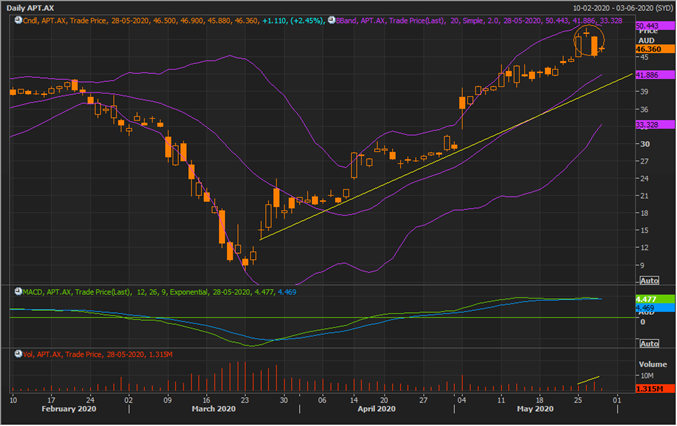
On the daily chart, it could be seen that the stock is presently trading above the pair of medium-term and short-term exponential moving averages with a positive crossover among them. The exponential moving averages are in ascending order (top to down), i.e., the shortest EMA (9-day) is at the top while the longest EMA (200-day) at the lowest, which in turn, is reflecting on the strong price momentum gained by the stock.
However, the stock is presently trading below the linear regression line ($47.017) with a falling slope (0.474), reflecting on the impact of the recent offloading from the Mitsubishi UFJ Financial Group, Inc.
APT Daily Chart (Source: EODHD/Others Eikon Thomson Reuters)
On further analysing the daily chart, it could be seen that the stock rose to test the +1 Standard Deviation (SD) of the 20-day simple Bollinger band and is now retracting. The stock completed an evening star candle on 26 May 2020, this 3-candle pattern is considered to be a top formation pattern. This might prompt the stock to test the mean value of the Bollinger band or the 20-day simple moving average (mean reversion principle).
The 12,26,9 MACD indicator, which is yet slightly bullish, is presently showing a narrow spread between the signal line and the base line.
In the near-term, the mean value of the Bollinger band and the short-term trendline should act as the primary support for the stock. Also, as the support suggested by the trendline and the mean value of the Bollinger band is overlapping, it should be considered as decisive support, and investors should monitor the same level closely as a move above the same or failure to do so would decide further price behaviour of the stock.
- APT Weekly Chart Analysis
APT Weekly Chart (Source: EODHD/Others Eikon Thomson Reuters)
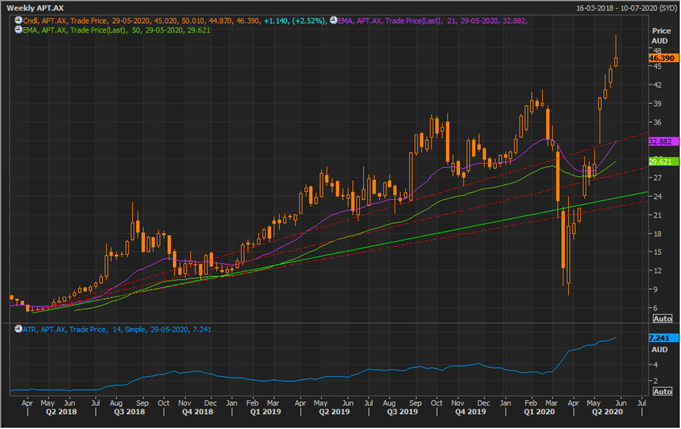
On the longer timescale (weekly chart), the stock is also demonstrating a shooting star candlestick; however, the current week has yet one remaining trading session, and the average true range of the stock is $7.241 or ~ 15.60 per cent of the current market price (CMP), which keeps the stock open for a 15.60 per cent move in a day; thus, the candle which is currently presenting itself might or might remain the same ahead, and investors should monitor the same.
If the weekly candle ends up forming a shooting star, investors should further look for the breach of the low of the same candle, which would confirm a bearish sentiment, else they should look for other signals to confirm and assess the market sentiment.
On projecting the Fibonacci fan via connecting the historic low to the recent high, it could be seen that the rally started after breaching the resistance of the 1/3 fraction of the Fibonacci fan, which should now act as the primary support for the stock.
Also, the 21-day EMA and the 1/3 fraction of the Fibonacci fan are merging, which makes the support level decisive in nature over the medium-term, followed by the 2/3 fraction, the shot-term trendline, and the 3/3 fraction of the Fibonacci fan.
While until now, we addressed the shot-term movement and major support levels, which are all part of a minor trend, let us now try to spot the direction of the primary trend.
APT Weekly Chart (Source: EODHD/Others Eikon Thomson Reuters)
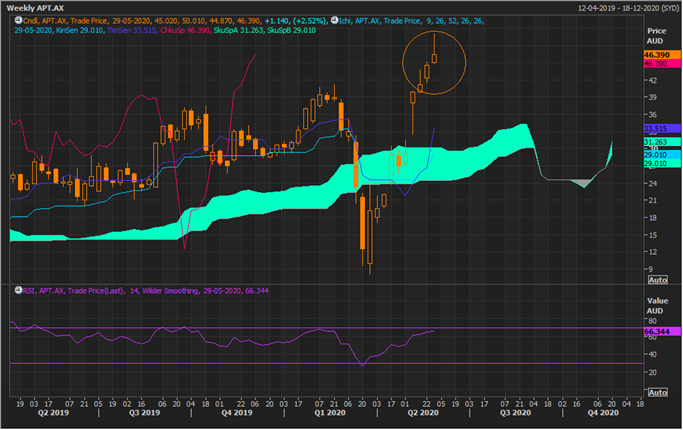
On the weekly chart, it could be seen that the stock is currently trading above the Span A of the Ichimoku cloud, which denotes the mean value of the conversion line (mean value of 9-week high and low) and the base line (mean value of 26-week high and low), while Span A is itself above Span B or the mean value of 52-week high and low, reflecting that the major primary trend is an uptrend.
Furthermore, the conversion line (dark blue) is showing a positive cross with the base line (sky blue) above the Span A, which is further pointing at the strength of bulls or the prevailing bullish sentiments around the stock.
The 14-week Relative Strength Index is moving in tandem with the primary trend and is above the mean value and below the overbought zone, suggesting that bulls are in major strength in the status quo.
