


Discounted cash flow is a method used for valuation and estimation of the worth of an investment today with the help of an estimated future cash flows. The method is driven by the concept of calculating the present values of the future expected cash flows by using an appropriate discount rate.
The return from an investment includes a time value factor, and hence, it needs to be discounted to arrive at the value of the investment at the current date.
The time value of money is a key concept since it values a dollar today higher than tomorrow. To understand the logic better, let us dive deep into the concept. When the investor invests his or her money, they are rewarded with a return on the investment; however, this return is ploughed back to him after a span of time or the span of the investment.
It is precisely for this time value factor that a discounted cash flow method is used to arrive at the worth of the investment today. Any financial asset ideally generates a series of cash flows over a period, which the investor receives either through an annuity or one-time post the investment is made, also known as the terminal period of the investment. However, the value of the investment after a span of time cannot be equated merely to its current worth due to the abovementioned factors. So, to incorporate the time value of money, Discounted Cash Flow method can be used.
âFree Cash Flow to The Firmâ (FCFF) and âFree Cash Flow to Equityâ (FCFE) are two standard values that are used to discount and arrive at the intrinsic value of the company. In FCFF method, the total free cash flow available to the company or firm are forecasted for the future periods, and discounted using the âWeighted Average Cost of Capitalâ (WACC) to arrive at present valuation, whereas the Free Cash Flow to Equity or FCFE method use the residual free cash available to the equity holders after meeting the liabilities of the external debt-holders and use the âRequired Rate of Return/Cost of equityâ (Ke) as the discount rate to arrive at the present values.
To perform a DCF, estimates of future cash flows and the terminal value of the investment are required. The cash flows can then be discounted using the interest rate that includes the prevailing risk-free rate in the economy with an additional market premium as a compensation for the risk. The required rate of return could be calculated as Re=Rf+ (Rm-Rf)*Beta, where Re is the required rate of return, Rf is the risk-free rate prevailing in the economy, (Rm-Rf) is the market premium as a compensation for the risk and Beta coefficient is the measure of the systematic risk.
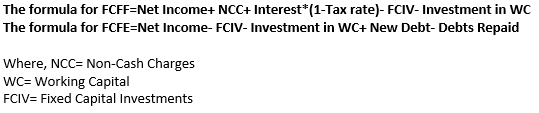
Formula For FCFF And FCFE
Generally, we can use these formulae to calculate the FCFF and FCFE for the firm. Ideally, we calculate these for the historical periods and then forecast these numbers for some future periods. It must be noted that the FCFF and FCFE can be calculated starting from several metrics other than net income, like EBIT, EBITDA, PAT. However, the formulae must be adjusted accordingly.
Once the future cash flows are being projected till a terminal year, we then use the formula to arrive at the present value in the current year for all the projected FCFFâs till the terminal period.
PV at any year can be calculated as
PV=FCFF1/(1+r) +FCFF2/(1+r)2+FCFF3/(1+r)3â¦..
so on and so forth till the final year to arrive at the value in a present year. r is the discount rate used to arrive at the present value.
However, the DCF method has several disadvantages as well, including the assumption of the discount rate(r), determining the growth rate of the future cash flows, etc. Despite several disadvantages, it is very widely used method by the analysts in finance to arrive at the present value of investments.
To perform a DCF analysis, we must forecast the key items of the company on a more granular level to arrive at a more accurate valuation. It must be remembered that the intrinsic value is an approximation, and more accurate the inputs and assumptions are while forecasting, we will reach a valuation, which tends to be more accurate.
To perform an analysis on any stock being attractive or worth investment, we must perform a DCF analysis to find the intrinsic value of the stock and compare with its current market price to arrive at a conclusion, whether the stock is undervalued or overvalued. If the intrinsic value is lower than the current market value then the stock is considered to be overvalued and if the calculated intrinsic value is above the current prevailing market price, then it is considered to be undervalued.
We can look at several fundamental factors while analysing the stock using DCF. However, few very essential parameters we can look at are revenues of the company, the bottom line, operating expenses, free cash, capital expenditure of the company, debts of the company and working capital.
Let us look at the aforesaid factors in depth.
Revenues: This is considered as one of the primary factors in analysing a company and its future performance. This is the driving force of the future performance and profit generation of the company. The revenue drivers of the company play a very significant role in determining the strength of revenue generation going forward. To analyse the revenue, we can further go in depth to perform a detailed study on factors driving the revenues at a granular level, which might include the customer base product quality, industry trends, economic data and the company's competitive advantages. Operating Expenses: This is considered as a very critical factor in deciding the success of the company since these are expenses required by the company to operate on a daily basis. The impact of the operating expense is significant as this can form a substantial part of the business expenses, and the company must make an effort to reduce these expenses over the long-term to generate a greater amount of profits. Hence, it becomes very important and difficult to forecast these expenses with precision in determining future cash flows.
Free Cash: The most important factor considered while analysing a business is its free cash. This is a vital parameter as it helps the business to meet its daily expenditures and any investment requirements without resorting to external debts, which can be a burden for the business. It is considered even more important than profit since profits are represented on an accrual basis, while cash represents the genuine strength of the firm.
Capital Expenditure: These are considered important and substantial costs of the business, as CapEx is required for growth and maintenance of the business. So, forecasting CapEx with precision is important as well, however, it is not always easy due to the nature of the business or decisions of the company to fund CapEx based on available projects.
Debts: Debt is considered a vital factor in deciding the companyâs success. Ideally, companies with larger CapEx can resort to higher debt funding, however, excessive debt in the capital mix of the firm can be a burden for the company. Although higher leverage can boost the returns, it can still be risky as well.
Working Capital: The liquidity, operational efficiency and short-term financial health of the company can be measured by the Working Capital. A company with more working capital that is more current assets than its current liabilities will have growth to sustain the business over a period. It becomes important to forecast working capital accurately.
Considering the above factors, let us have a look at the financials of a few Australian stocks like NAB, BLD, BHP, SUL, GEM.
National Australia Bank Limited (ASX: NAB) The reported net profit for the bank posted a growth of 4.3% to $2,694.0 million in 1H FY19 and an increase of 1.0%, excluding the impact of discontinued operations.
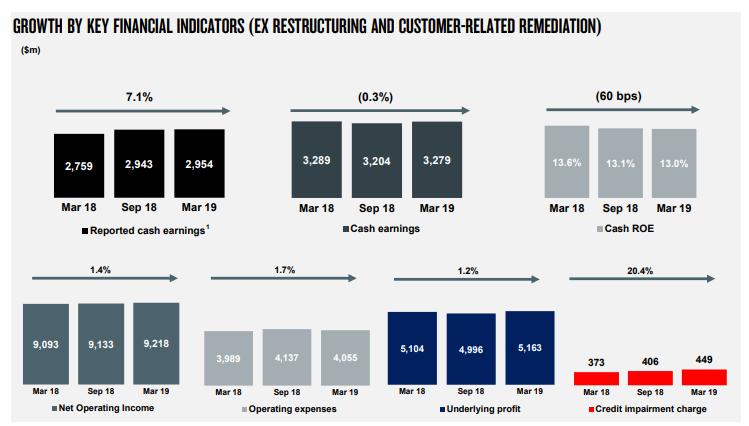
Group Financial Performance (Source: Company Reports)
The cash earnings of the company came in at $2,954 million, including the impact of customer-related remediation of $325 million in the March 2019 half year and restructuring-related costs of $530 million in the prior corresponding period.
Boral Limited (ASX: BLD) Revenue from continuing operations for the company was up 4.6% to $2,928.8 million in 1H FY19 as compared to $2,798.7 million, primarily driven by North America segment, which recorded a growth of ~11% in top line for the same period. The company delivered a return on funds employed (ROFE) of 8.1%, with Australiaâs ROFE of 15.9% during the first half FY19.
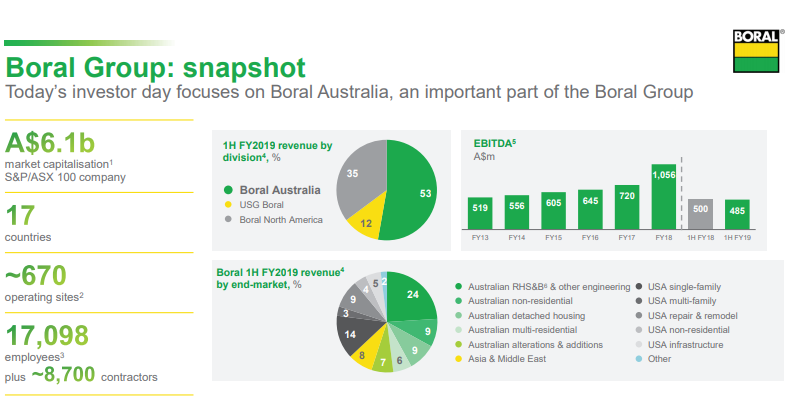
Company Snapshot 1HFY19 (Source: Company Reports)
BHP Group Limited (ASX: BHP): In FY2018, strong cash flows were generated on the back of higher prices and a robust operating performance helping the company to reduce the net debt and increase the dividends. On the financial front, the company reported US$43,638 million in net revenues in FY18 compared to the restated number of $36,135 million in FY17, up by 20.8% Y-o-Y, primarily driven by global materials demand from China. The net income after tax from continuing operations stood at US$7,744 million in FY18 compared to US$6,694 million in FY17, up by 16.0% approximately, driven by higher operating and investment and interest income.
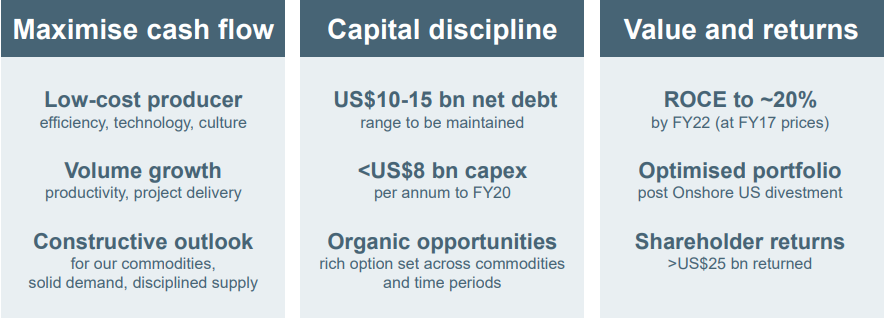
Investment Proposition Of BHP (Source: Company Reports)
Super Retail Group Limited (ASX: SUL): Sales for the period were $1,403.2 million as compared to $1,323.7 million in 1H FY18, reflecting an increase of 6.0 per cent, with core businesses delivering solid sales, including a strong contribution from Macpac and investment in omni-retail capabilities. The normalised net profit after tax stood at $81.6 million, an increase of 8.9 per cent over the prior corresponding period.
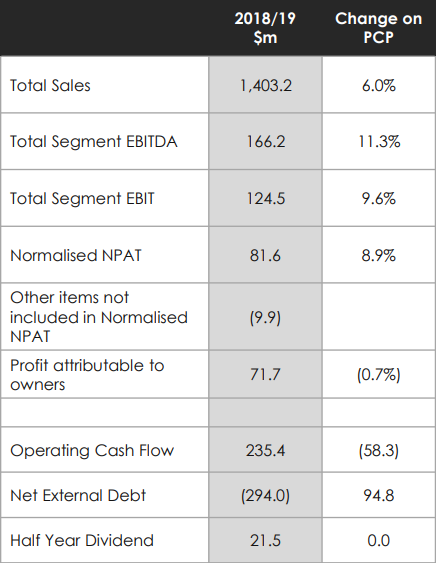
Group Results 1HFY19 (Source: Company Reports)
G8 Education Limited (ASX: GEM): The group has strong cash flows with reported EBITDA to cash conversion of 107% and underlying cash conversion of 98%, along with a revenue increase of 8.0% to $857.75 million in 1H FY19.
Although we have discussed few key parameters, it is always good to have an extensive study while performing DCF to understand the future performance of the business with precision and as a result, it is better to look into these parameters in conjunction with the other detailed analysis.
Disclaimer
This website is a service of Kalkine Media Pty. Ltd. A.C.N. 629 651 672. The website has been prepared for informational purposes only and is not intended to be used as a complete source of information on any particular company. Kalkine Media does not in any way endorse or recommend individuals, products or services that may be discussed on this site. Our publications are NOT a solicitation or recommendation to buy, sell or hold. We are neither licensed nor qualified to provide investment advice.
