


Macquarie Group Limited (ASX:MQG) is one of the biggest financial services company in Australia with a market cap of more than 43.17 billion dollars. Macquarie Group is one of those stocks on ASX that had enjoyed its bull run from 2012 when the price was hovering around A$23-A$25 in January 2012 all the way up to the high of A$129.87 on 3rd September 2018. The rally was so smooth except a few hiccups that almost any trend following indicator would have given a decent return to the investors.
In early September 2018, the stock touched its lifetime high at A$129.87. Around these levels, the Relative Strength Indicator (RSI) also marked the reading just above 70 on a daily chart. Any reading above 70 is considered to be an overbought condition for the stock which leads to a contrary view of expected selling. Another bearish signal was noticed when the prices were hovering near its high. As seen on the price chart below when the stock kept on making a new high, simultaneously the RSI indicator failed to make its new high. This is called Bearish Divergence (as the prices were moving higher but the indicator was moving lower). The overbought condition at the top combined with bearish divergence is a no brainer for anyone looking for a sell signal.
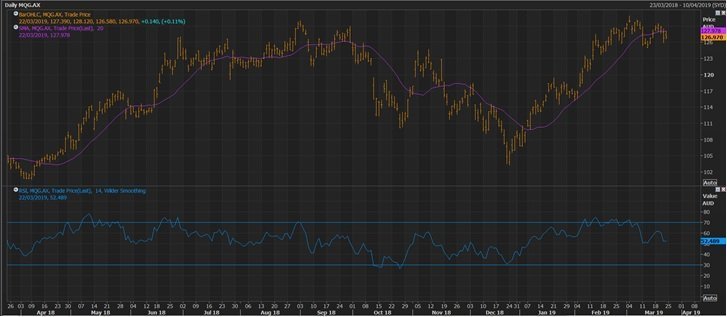 Stock Price and RSI (Source: Thomson Reuters)
The prices were already soared to quite high levels that the buyers couldnât keep the prices higher and selling started to kick in. The price range around A$129 â A$130 became an expensive bet for the investors which was evident in the continued selling that took place thereafter. After touching the high, the prices gradually started to decline and in due course of correction price level of A$103.3 was hit in December 2019 which is about 16% correction from the top.
After making a short term bottom of A$103.3, the stock rose sharply in one direction, and within a few weeks, the stock had touched the level of A$119 as at January 2019. After this one-sided rally, the fight between the bulls and bears started again, and the stock couldnât go anywhere for a few days, which made a consolidation zone. This consolidation was converging in nature, i.e. after every day passing by the range (high and low) of the price started squeezing. This one-sided rally with converging consolidation led to the formation of a bullish pennant pattern.
This is a bullish continuation price pattern and very similar to the flag pattern. The only difference is the consolidation in flag pattern takes place in a channel while in the Pennant pattern the consolidation is converging. On 5th February 2019, a clear breakout was witnessed which continued the rally up to the new lifetime high of A$130.88. Then again, the bears overpowered the bulls, and again the stock corrected to A$125 odd levels. The stock is continuously facing strong resistance from these levels making A$130 a strong supply zone.
As of 22nd March 2019, the stock was hovering around A$126.97, and a further rally could only be expected after a breakout above A$130 with heavy volume. At the bottom, it has support around A$125. This one is surely a financial sector stock that investors are watching closely.
Disclaimer
This website is a service of Kalkine Media Pty. Ltd. A.C.N. 629 651 672. The website has been prepared for informational purposes only and is not intended to be used as a complete source of information on any particular company. Kalkine Media does not in any way endorse or recommend individuals, products or services that may be discussed on this site. Our publications are NOT a solicitation or recommendation to buy, sell or hold. We are neither licensed nor qualified to provide investment advice.
