


Listed Investment Companies
These companies are similar to a Managed Fund, with a difference wherein investors can buy and sell shares in these companies on ASX (Australian Stock Exchange) just like ordinary shares. They donât issue or cancel new shares as they are closed investment funds and the fees for managing these funds are usually higher than Exchange Traded Funds (ETFs). Moreover, they have performance fees as well and Alpha from LICs are expected to be better than ETFs especially via certain investment strategies and sometimes through use of gearing.
Certain LICs deploy both long and short strategies to tap the best opportunities in the market. A long position in an equity suggests that the equity share price movement is expected upside, on the other hand a short position in an equity suggests that the equity share price movement is expected downside. Both the strategies are also deployed by fund managers in case of negative correlation between different industries. For example, an increase in oil price is good for energy sector, so a long position can be maintained, whereas oil price hike is negative for automobile sector, so a short position can be maintained in it.
Few Important LICs are Argo Investments Limited (ASX:ARG), Australian Foundation Investment Company Limited (ASX:AFI) and L1 Long Short Fund Limited (ASX:LSF).
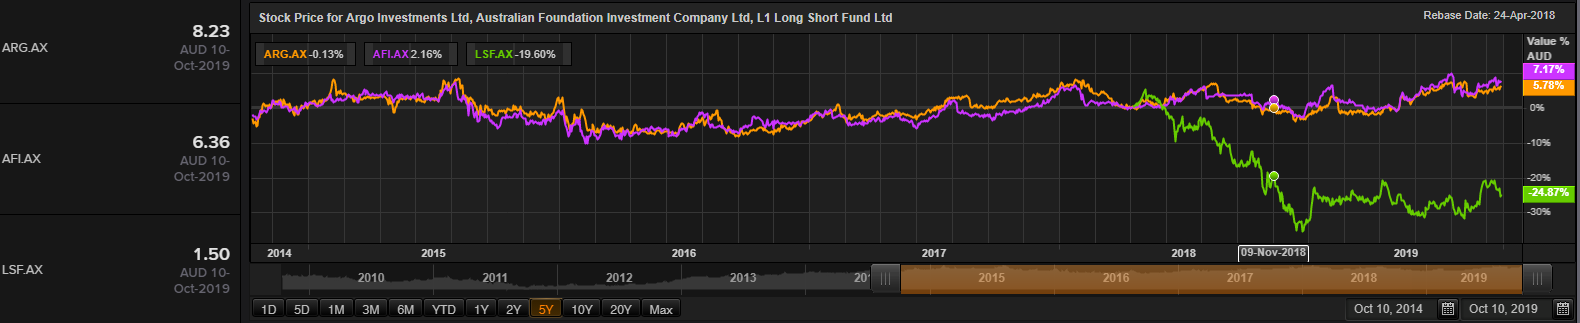
Comparative Chart (Source: Thomson Reuters)
Argo Investments Limited (ASX:ARG)
Argo Investments Limited (ASX:ARG) is involved in the investment of funds in Australian listed securities and short-term interest-bearing securities. Its wholly owned subsidiary provides management services to an external listed investment company under an Australian Financial Services Licence. Recently, the company published its investment update, where it highlighted that its net tangible asset (NTA) per share on September 30, 2019 was reported at $8.44 as compared to $8.20 on August 31, 2019. NTA per share after unrealised tax provision on September 30, 2019, was reported at $7.38 as compared to $7.20 on August 31, 2019.
Its top 20 investments exposure forms 59.1% of the total portfolio is as follows:
- Westpac 5.8%
- Macquarie 5.3%
- ANZ 4.6%
- BHP 4.5%
- CSL 4.3%
- CBA 4.1%
- Wesfarmers 3.3%
- Rio Tinto 3.2%
- NAB 3.1%
- Telstra 2.5%
- Australia United Investment 2.2%
- APA 2.0%
- Transurban 2.0%
- Ramsay Healthcare 2.0%
- Woolworths 2.0%
- Sydney Airport 1.9%
- Sonic Healthcare 1.7%
- Aristocrat Leisure 1.6%
- QBE Insurance 1.5%
- Origin Energy 1.5%
As per sectoral allocation, its maximum exposure is in Banks (17.3%) followed by Materials (13.3%), Other Financials (11.0%), Health Care (9.6%), Industrials (7.2%), Consumer Staples (4.4%), Consumer Discretionary (10.2%), Telcos & I.T. (5.8%), Energy (5.4%), LICs (4.8%), Utilities (3.4%) and Property (3.4%). Remaining 4.2% were held in the form of cash.
On the stock information front
On October 11, 2019 at 1:57 PM AEST, ARG quoted $8.240, trading up by 0.12% with the market cap of ~$5.91 Bn. Its current PE multiple is at 20.020x and its last EPS was noted at $0.411. Its 52 weeks high and 52 weeks low stand at $8.370 and $7.470, respectively, with an annual average daily volume of 197,771. It has generated an absolute return of 3.78% for the last one year, 7.86% for the last six months, and 0.86% for the last three months.
Australian Foundation Investment Company Limited (ASX:AFI)
Australian Foundation Investment Company Limited (ASX:AFI) has investment exposure in the Australian and New Zealand equities. Recently, the company announced its investments update as on September 30, 2019, where it highlighted that its net tangible asset (NTA) before and after tax for the period was reported at $6.48 and $5.51, respectively. Its NTA before and after tax on August 31, 2019 was reported at $6.35 and $5.41, respectively.
The company aims to provide attractive investment returns to its shareholders with the enhancement of capital invested over the medium to long term. Its benchmark is S&P/ASX 200 Accumulation Index, and holds a portfolio size of $7.8 Bn (as on September 30, 2019)
Its top 25 investment exposure forms 75.5% of the portfolio are as follows:
- Commonwealth Bank of Australia 8.3%
- BHP 6.4%
- CSL 6.4%
- Westpac Banking Corporation 6.0%
- National Australia Bank 4.9%
- Transurban Group 4.4%
- Macquarie Group 3.6%
- Wesfarmers 3.5%
- Australia and New Zealand Banking Group 3.4%
- Woolworths Group 2.7%
- Rio Tinto 2.3%
- Amcor 2.3%
- Sydney Airport 2.0%
- James Hardie Industries 2.0%
- Telstra Corporation 1.8%
- Woodside Petroleum 1.8%
- Brambles 1.8%
- Oil Search 1.7%
- Mainfreight 1.5%
- Sonic Healthcare 1.5%
- Ramsay Health Care 1.5%
- Qube Holdings 1.5%
- Coles Group 1.4%
- Treasury Wine Estates 1.3%
- Seek 1.2%
As per sectoral allocation, its maximum exposure is in Banks (22.1%), Industrials (15.6%), Materials (15.5%), Healthcare (11.7%), Other Financials (10.0%), Consumer Staples (5.7%), Consumer Discretionary (4.9%), Energy (4.2%), Communication Services (3.6%), Information Technology (2.8%), Utilities (1.2%) and Property Trusts (0.7%). Remaining 2.0% were held in the form of cash.
On the stock information front
On October 11, 2019 at 2:13 PM AEST AFI quoted $6.370, trading up by 0.15%, with a market cap of ~$7.7 Bn. Its current PE multiple is at 19.800x and its last EPS was noted at $0.321. Its 52 weeks high and 52 weeks low stand at $6.540 and $5.747, respectively, with an annual average daily volume of 370,502. It has generated an absolute return of 3.22% for the last one year, 8.35% for the last six months, and 1.11% for the last three months.
L1 Long Short Fund Limited (ASX:LSF)
L1 Long Short Fund Limited (ASX:LSF) invests predominantly in Australian securities (both long and short), with an objective to provide positive and absolute returns for the investors focussing to preserve capital in the long term span.
Recently, the company announced its investment update as on September 30, 2019, where it highlighted that its net tangible asset (NTA) pre-tax and post-tax for the period was reported at $1.7379 and $1.8256, respectively. As per the companyâs portfolio, the number of positions held by it as on September 30, 2019, was reported at 83, under which number of long and short positions for the period was reported at 52 and 31, respectively. Its gross long and short exposure stood at 139% and 79%, respectively. As per the portfolio performance, its past one-year return stood at 4.20% and its performance for three months and one month stood at 3.61% and 2.53%, respectively.
Sectors which performed better in the month of Septemberâ19 were energy (4.7%), financials (4.1%) and materials (3.1%), whereas sectors which underperformed were healthcare (-0.1%), communication services (0.2%) and consumer staples (0.7%).
Its long position in Bellamyâs and Boral, were highly rewarding in September as the stocks rallied 73% and 13.6%, respectively. Its long position in Ausdrill was rewarding as well as it was bought at a P/E of only 5-6x FY20 earnings, following a dramatic fall in its share price from $1.70 to $1.10 in Nov-Dec last year.
On the stock information front
On October 11, 2019 at 2:23 PM AEST LSF quoted $1.495 with the market cap of ~$993.93 Mn. Its 52 weeks high and 52 weeks low stand at $1.785 and $1.270, respectively, with an annual average daily volume of 978,501. It has generated an absolute return of -14.08% for the last one year, 2.75% for the last six months, and 4.91% for the last three months.
Disclaimer
This website is a service of Kalkine Media Pty. Ltd. A.C.N. 629 651 672. The website has been prepared for informational purposes only and is not intended to be used as a complete source of information on any particular company. Kalkine Media does not in any way endorse or recommend individuals, products or services that may be discussed on this site. Our publications are NOT a solicitation or recommendation to buy, sell or hold. We are neither licensed nor qualified to provide investment advice.
