


Gold prices experienced another uptick after gold spot closed on a positive note at $1302.02 (close on 12th March). The recent events in the global economy and economic indicators led to the surge in gold prices and gold finally breached the psychological level of $1300.
In the global event, Brexit faced another halt after the U.K parliament rejected the Prime Minister Theresa Mayâs renegotiated Brexit withdrawal agreement by a majority. The rejection of the renegotiated agreement further induced a cascade of panic in the market over the uncertain environment prevailing in the U.K.
The U.K. parliament pinned down the Brexit withdrawal agreement put forward by the president Theresa May by a majority of 149 votes against the agreement supporters. U.K. lawmakers voted 391 to 242. The rejection of the renegotiated agreement, which was earlier supported by European Union, instigated a fear to pass the Brexit deadline of 29th March 2019 among the market participants, which in turn provided an impetus to the gold prices and the prices noticed a close above $1300 mark.
Another factor which supported the gold prices along with the fear among market participants was the weak economic indicators from the U.S. economy. The Core consumer price index (CPI), which is reported on a monthly basis, reported the figure at 0.1% for February 2019. The drop in the CPI m/m, as compared to the market expectation of 0.2%, exerted pressure on dollar prices.
The dollar index (DXY) slipped and closed on a negative note at 97.01 (as on 12th March). The dollar index plunged from the level of 97.27 (dayâs high on 12th March) to the mark a low of 96.86 on the same day. The fall in dollar prices further added to the impetus provided by the fear of Brexit delay and supported the gold prices.
The rise in gold prices was axiomatic in terms of falling U.S-10-year bonds yield-to-maturity; the fall in the market discount rate over the Brexit delay fears, justified the rising gold prices.
With the psychological level breached in gold, gold can now either head northwards or trace back to its roots, and that will entirely depend upon development in global economies and on fear and greed factor, which is taking roots on account of many such global events, which hampers gold prices.
Other than the global economic development, the market participants will keep a Hawkeye on the developing relationship between the U.S. and China, and whether or not these countries reach a resolution to end the long-standing trade dispute.
On the data front, to further gauge the direction of gold prices, the investors and speculators will monitor the various economic indicators such as Producer Price Index, weekly Unemployment Claims, and new home sales, all due for this week.
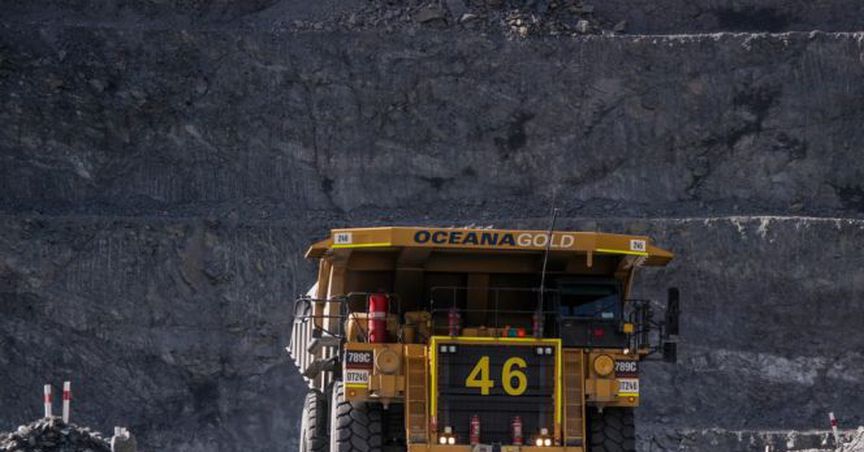
While gold may be perhaps getting ready for a one side move, let us see, how Australian Gold miner OceanaGold is performing in terms of projects, exploration, financial performance and on charts.
OceanaGold Corporation (ASX: OGC)
The company holds business in the United States of America, Philippines, and New Zealand, and adopts a strategy of maximizing the mineral resources, plant, and equipment, and operates within a regulatory environment to avoid any conflict of interest between the local government and the company. The company recently presented an investors presentation, which highlighted the strong point for the stakeholders of the company.
The company operates Haile Gold mine, which produced 118,466 ounces of gold in 2017, and is located in South Carolina in the U.S.A. The mine is an open pit mine with an estimated life of more than 13 years and hosts a combined of measures and indicated resources of 3.32 million ounces of gold and an inferred resource of 0.6 million ounces.
To further extend the mine life and estimated mineral resources, the company discovered high-grade intercepts during extended drilling in Haile.
Oceana operates the Didipio underground mine in the Philippines and produced 176,790 ounces of gold in 2017 and the underground mine hosts combined of measured and indicated resources of 1.39 million ounces of gold and 2.88 million ounces of silver. The mine hosts inferred Resources of 0.3 million ounces of gold and silver.
The Waihi underground mine in New Zealand produced 119,084 ounces in 2017 and hosts a combined measured and indicated resource of 0.36Moz of gold and double p (proven and probable) resources of 0.24Moz of gold.
The company recently explored Wharekirauponga project, which further added to the existing mineral resources.
With such extensive operations and exploration activities, the company stands in an excellent position to produce gold and take a leap if any gold up-wave arrives. The companyâs adaptability to replenish its mined ores is another factor which places it to book future cash inflow from rising commodity scenario.
Performance on Charts:
Source: Thomson Reuters: OGC daily chart
Following the developments on the daily chart, the stock is trading above its 200 EMA, which is valued at A$4.223. The shorter seven days-EMA and medium smoothened 20-EMA shows a golden cross over, which marks a good bullâs presence. The relative strength index (14) valued at 53.920 is well above its mean value of 50.
During the time of writing this report, the shares of the company closed on a positive note at A$4.640 (as on 13th March 2019, 06:06 PM), up by 0.87% as compared to its previous close.
Disclaimer
This website is a service of Kalkine Media Pty. Ltd. A.C.N. 629 651 672. The website has been prepared for informational purposes only and is not intended to be used as a complete source of information on any particular company. Kalkine Media does not in any way endorse or recommend individuals, products or services that may be discussed on this site. Our publications are NOT a solicitation or recommendation to buy, sell or hold. We are neither licensed nor qualified to provide investment advice.
