


S&P/ASX 200 is convalescing after a brief sell-off due to a recovery in some of the heavyweights of the index. However, while the market is showing some upswing, dilemma persists around the present rise in many indices and underlying stocks, and the market participants are analysing if the recovery is a dead cat bounce or an early sign of a trend reversal.
Today, at Kalkine, we would try to analyse the S&P/ASX 200 index and some of its heavyweights in order uncover the underlying trend, and we hope that our ongoing series of analysing technical charts would come handy in making a sound decision.
Technical Analysis on Gold: Volatility the Pulse of the Market: A Reading of Gold Pulse Across Multiple Time Frame
Let’s Begin!
S&P/ASX 200 Index
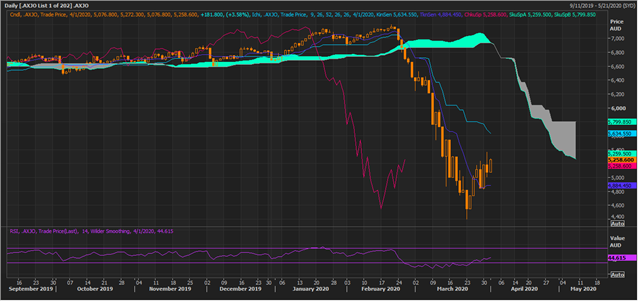
XJO Daily Chart (Source: Thomson Reuters)
On the daily chart, it could be seen that the index is currently trading below Span B, which is the mean value of 52-day high and low, which could with a large spread between Span B and Span A (mean value of the conversion line (navy blue) and the base line (sky blue), suggesting that the primary trend is a downtrend.
Further, the conversion line, which is the mean value of 9-day high and low is showing a negative crossover with the base line, which is the mean value of 26-day high and low, which coupled with a large gap suggests that the current trend is strong.
However, the 14-day RSI, which is considered as a leading indicator, is showing divergence with the price action, which we would cover below.
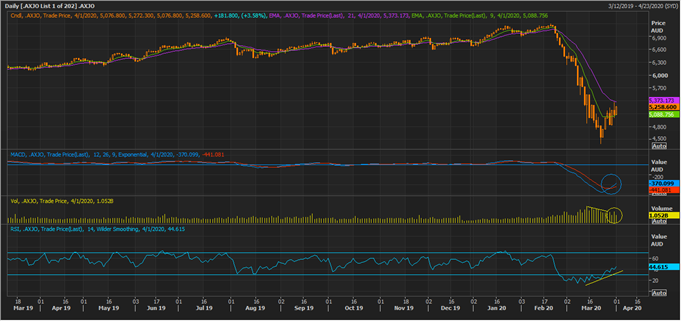
XJO Daily Chart (Source: Thomson Reuters)
On further analysing the daily chart, it could be seen that the index is rising from its recent low, and the short-term moving average is now sloping upward, while the moving average convergence and divergence or MACD indicator is giving a positive signal.
The 14-day RSI is behaving in tandem with the price action is moving up, which could with a positive MACD and steady volume, suggest that currently some accumulation is taking place, which is one of the early sign of a trend reversal; however, at the moment nothing could be confirmed as, such a phase should be ideally followed by some deep consolidation with steady volumes, which is currently absent, and would become clear in the future.
So, investors should keep on monitoring the move in S&P/ASX 200 closely, and ideally should look for less volatility, deep consolidation with steady to large volumes to confirm the early sign of a trend reversal.
S&P/ASX 200 Heavy Weights
- Goodman Group (ASX:GMG)
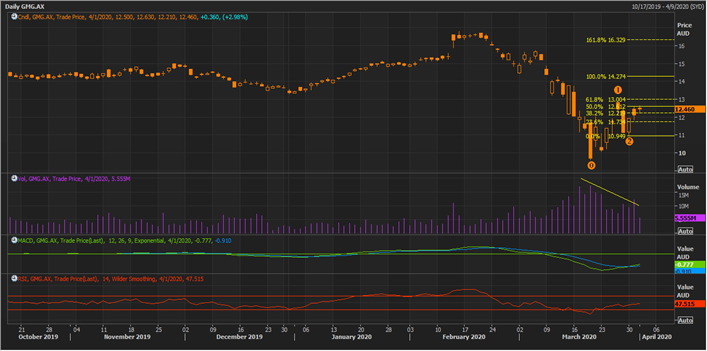
GMG Daily Chart (Source: Thomson Reuters)
On the daily chart, the stock is rising on weak volumes; however, the MACD is giving a positive signal. But, the spread between the short-term moving average with the medium-term moving average (in MACD) is low, which coupled with a below mean 14-day RSI suggests that the stock pattern could be hinting at a dead cat bounce.
However, until the price slips below the point marked as (2), it could not be assigned a higher probability, and likewise, the Fibonacci projects are still intact, suggesting pivot points. The stock is currently facing the hurdle around the 50.0 per cent to 61.8 per cent projected level.
The point (2) is the immediate support below which bears could get active; however, the confirmation of the trend continuation, i.e., downtrend confirmation would be below the point marked as (0), below which the trend would show a failure swing.
- Woolworths Group Limited (ASX:WOW)
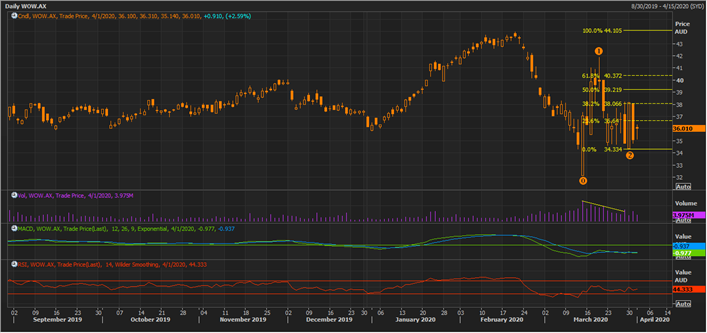
WOW Daily Chart (Source: Thomson Reuters)
On the daily chart, the stock is moving up and showing similar characters to the peer with a positive MACD, with a low spread between the short-term average and the long-term average. The volume is declining with the rise in price, which coupled with a price drop with good volume after a few days rise, suggesting that bears are presently dominating.
For the bulls to gain some interest, the stock has to make a new above via crossing above the 100.0 per cent Fibonacci projected level. The Fibonacci projections would hold true until the price slips below the point marked at (2), and downtrend continuation could be confirmed below point marked as (0).
- Telstra Corporation Limited (ASX:TLS)
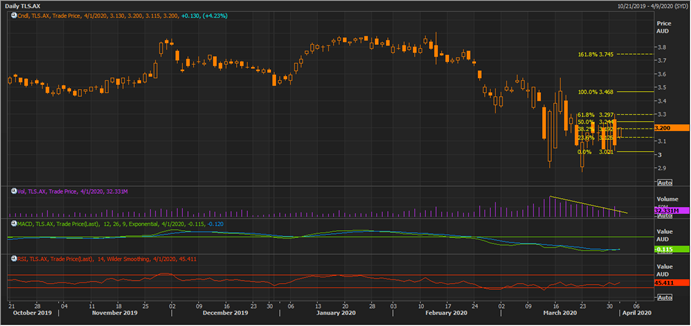
TLS Daily Chart (Source: Thomson Reuters)
On the daily chart, the stock is moving in a downtrend; however, the volume is continuously declining, which coupled with a positive signal from MACD suggest that the downtrend might be losing the momentum.
The current support of the stock is at $2.870, which is the recent low made by the stock on 23 March 2020. At present, the rise in stock is not supported by decent volume to give more confidence to the bulls , and the market participants should remain cautious and wait for firm trend signals, which would be either below $2.870 (bearish) or else above $3.570 (bullish), which is the high made by the stock on 17 March 2020.
- Woodside Petroleum Limited (ASX:WPL)
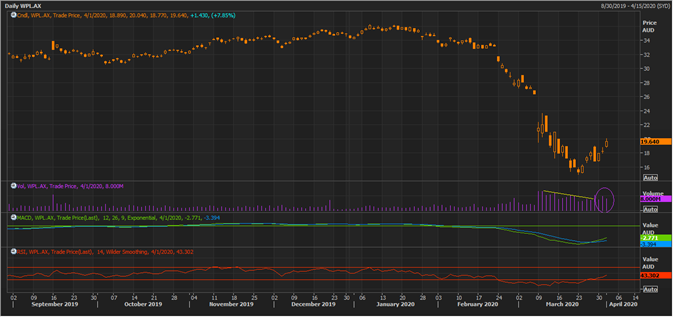
WPL Daily Chart (Source: Thomson Reuters)
On the daily chart, the stock is somewhat showing a similar behaviour as S&P/ASX 200 with a downtrend marking lower volumes, and price consolidating with steady volumes. The MACD is giving a positive signal; however, these accumulations should gain further volume and break above $23.600 to refill the breakdown gap, to confirm a trend reversal, and at present, the probability of a trend reversal seems low.
The immediate support of the stock is at $14.930, which denotes the low made by the stock on 23 March 2020. The stock is currently trading sideways, and a break below $14.930 or a break above &23.600 would confirm the further trend in it.
Investors should note that the above charts and levels have been provided by keeping trend following strategy in mid, which waits for many confirmation signals; however, day traders and swingers can further relay on the technical indicator to make an informative decision, but they also give equivalent importance to the volume trend before concluding their decision.
