


Summary
- Gold spot prices have demonstrated some strong gains until now, and the prevailing market sentiment is also seeming to be favouring gold.
- In the status quo, both side of the gold participants, i.e., both bulls and bears are engaged, and gold is now standing in the phase of consolidation.
- However, while the consolidation is taking place in the market, a lot of speculations are emerging, and market participants are currently digging for facts and figures, which could assist them in generating alpha.
- One such data is the net long position data on COMEX, which is currently showing discrepancies with the gold price.
- Ultimately, gold price movement itself is the biggest signal, which we should look at and analyse, as the modern adaptation of the Dow Theory suggests- “ Price Discounts Everything”.
The gush for gold is picking heat in the market with gold spot rising further to USD 1,765.94 over the dismal U.S. economic figures and prevailing sentiments concerning the lingering downtrend in the global economy.
To Know More, Do Read: Gold Rallies Over Dismal U.S. Economic Figures and Prevailing Sentiments Across Risky Assets
However, in the status quo, despite several negative forecasts related to global economic conditions, the market risk-taking capabilities seem to be improving in the wake of an upsurge in several global equity market indices including the S&P 500, Nasdaq, and Dow Jones Industrial Average, also a slight increase in the yields on longer-dated Treasury bills across the globe.
While the improvement in risk appetite is currently keeping gold prices under check with Australian spot consolidating, overall market sentiments seem to be yet favouring gold.
To Know More, Do Read: Gold in a Tug of War with AUD, Charts Point to Bulls Tiring and Consolidation
The recent rally in gold has briefly supported the market perspective on ASX-listed gold stocks, with a majority of them outperforming the overall market index (S&P/ASX 200) and gold by a considerable margin.
To Know More, Do Read: Gold Rush And the 52-Week High Landers- WAF,EVN, and AGG
In the status quo, gold daily-movement with consolidation in between and risk of sudden spike is keeping a lot of short-term investors wary, and the whole market is looking for some signals to gain advantage and navigate the market, which is currently very lucrative.
While these are unforeseeable times and no forecast is assertive in nature, the market itself is giving much-required signals which once assessed properly could be used for one’s advantage.
Fed Reiterates Awful Economic Conditions
In the status quo, the United States Vice Chair- Richard H. Clarida again reiterated over the gloomy global economic conditions while inflicting a heavy toll on the levels of activity and employment across the United States.
Mr Clarida further mentioned that while the GDP (in real terms) took a hit of 4.8 per cent during the first quarter of the year (on an annual basis), it could be estimated that it would further contract at an unprecedented pace during the second quarter.
Apart from the view on the deteriorating economy, the Vice Chair also mentioned in his recent speech that, the unemployment rate across the United States which stood at 3.5 per cent in February 2020 to mark a 50-year low surged to an 80-year high of 14.7 per cent in April 2020 and also is anticipated to rise further in May 2020.
However, Mr Clarida also suggested that while economic figures are gloomy, financial conditions have eased since the middle of March amidst the actions that Federal Reserve took in March followed by the creation of nine new credit facilities to support the flow of credit to households and companies.
To Know More, Do Read: Is FED Running Out of Bullets in Bringing Down The COVID-19 Impact? Oil Market Yet Under Duress
While concluding, the federal reserve Vice Chair also flagged that the COVID-19 outbreak poses an imminent threat to maximum employment and, potentially, to the price stability.
Mr Clarida’s statement and indication towards the further worsening economic conditions are further supporting sentiments around gold.
While on the event counter, the federal reserve Vice Chair’s warning is propelling speculations, on the data counter, recent figures concerning gold trading are also pointing towards bullish sentiments around the yellow metal.
For example since the beginning of the month, the total net long position across the COMEX is on a consistent increase with net long positioning increasing from 857.12 tonnes, seen at the beginning of the month (as on 4 May 2020) to 881.91 (for the week ended 19 May 2020), which marks an increase in net position of ~ 2.89 per cent.
Gold switched sentiments in the status quo from showing some bearish signs early to suddenly breach of the seven-year high, and the present data backs the recent shift well; however, there has been slight discrepancies, which should be analysed further.
To Know More, Do Read: Gold- A Likely Reversal of the Titan As Centrals Banks Puts Hiatus On Gold Buying?
For example, while the gold market is in consistent rally over the past few months, the overall net longs from February 2020 has been declining with net longs decreasing from 1,099.48 tonnes (on COMEX) to reach 858.48 in May 2020, which marks a decline of ~ 22.28 per cent.
While money managers were among the largest buyers previously, they have been reducing their net longs since February 2020, when the net money managers long position stood at 785.4 tonnes, to the present level of 524.68 tonnes, down by ~ 26.82 per cent.
Apart from that, as the modern adaptation of Dow Theory suggests, price discounts everything, and every price denotes a point of mutual agreement between a buyer and a seller after considering all the relevant information. So, let us know turn over focus towards the price behaviour and pattern formation to determine the possibility of the future movement.
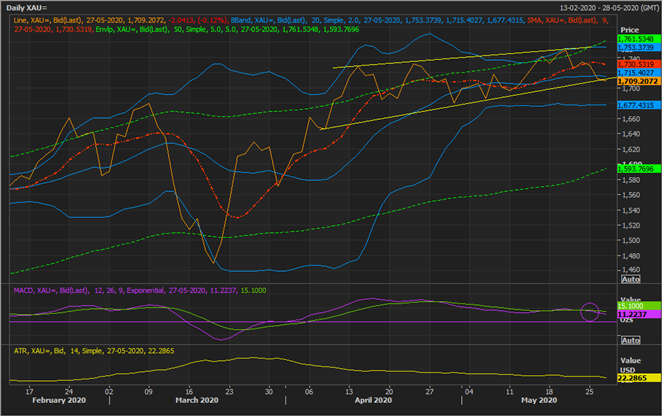
XAU Daily Chart (Source EODHD/Others Eikon Thomson Reuters)
On the daily chart, it could be seen that the gold spot is currently trading in a channel which is now narrowing with a slight upward slope, reflecting on the consolidation phase of the primary upside rally. Also, post touching the upper line of the consolidation channel, the gold spot is now retracing back towards the bottom line of the channel.
Gold prices recently touched the +1 Standard Deviation (or SD) of the 20-day simple Bollinger band and are currently moving towards the mean value of the band. Furthermore, the gold spot has reached the + 5 per cent range of the 50-day average price (upper green line), and it should be noticed that the +1 SD, the upper line of the channel, and +5 per cent of the 50-day average price are all overlapping, which in turn, makes the level a decisive resistance for the price, and investors should monitor the same closely as a break and sustain above the same or failure to do so would decide further price action in the gold ahead.
On the downside, the gold spot has just breached the 9-day EMA (red line) and is now testing the bottom line of the channel, which is overlapping with the mean value or the 20-day simple moving average, suggesting that the current support is also decisive in nature.
Furthermore, the 12,26,9 MACD is giving a negative signal, while the volatility is losing momentum when the spot is at the crucial support. Investors should monitor the support zone as well as multiple indicators, and studies are pointing around the same support level is making it crucial and decisive in nature.
