


Crude oil prices are moving down in the global market amid building pessimism among market participants over a global economic slowdown in the wake of re-escalated U.S-China trade war. The Brent Crude plunged from the level of US$75.72 (Dayâs high on 25th April 2019) to the level of US$67.14 (Dayâs low on 23rd May 2019).
However, the prices took support from the level of US$67.14 due to the rising tension in the middle east and supply loss of Saudi in the wake of the recent attack on its oil tankers.
Brent crude prices are witnessing a see-saw motion, with supply concerns supporting the prices while the estimated reduction in demand is exerting pressure on oil prices.
However, in the recent status quo, an estimated demand reduction seems to dominate over the supply constraint, as market participants predict that the bilateral disagreement between the United States and China would impact the global growth, which in turn, would eventually reduce the global demand for oil.
Over the dominancy of predicted demand reduction, crude oil prices are facing the selling pressure in the international market. While on the supply side, the United States Energy Information Administration (EIA) has predicted that, OPEC members are likely to decide on increasing the production in the upcoming OPEC meeting in June 2019.
Another factor which is contributing to the fall in oil prices is the dollar appreciation. Recently, dollar prices have gained momentum against the currencies of developing economies, which in turn, is making developing countries to cut on the crude oil purchase amid high valuation of the crude prices in dollar terms.
A dollar gain supports the oil prices, but in the recent scenario the high appreciation of the dollar is making crude expensive, which is prompting the oil importers to curb the purchase; therefore, the selling pressure is building in the absence of high purchases, which in a cascade exerting pressure on the oil prices.
Crude oil on Charts:
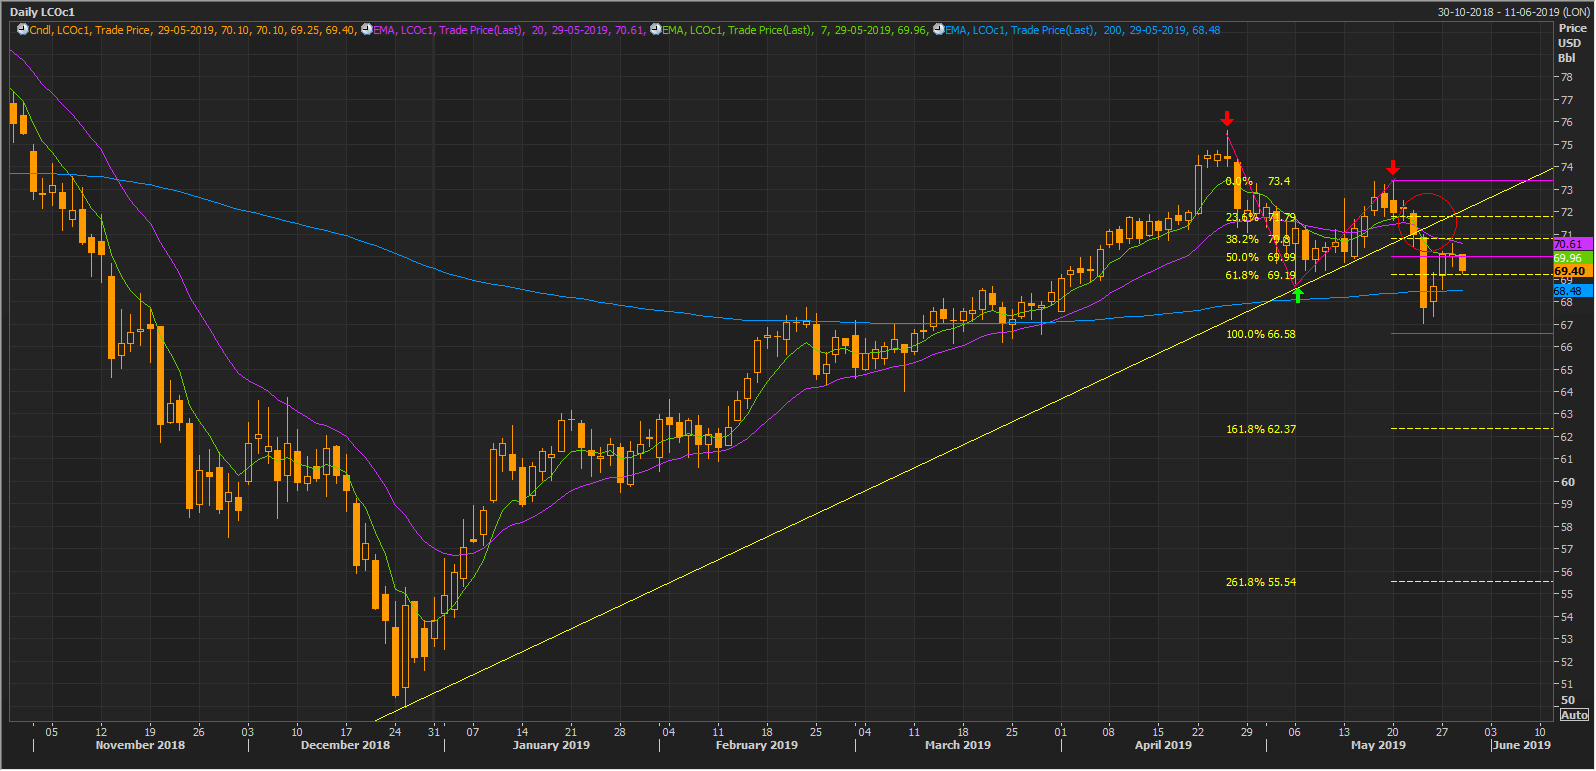 LCO Daily Chart (Source: Thomson Reuters)
After carefully noticing the daily chart, it can be seen that the oil prices dropped from the level marked with red downside arrow on the above-shown chart. The oil prices recently broke its long-term uptrend line, shown in the chart with a yellow line.
Prior to breaching the long-term trendline, the prices fell and rose without crossing the previous high of US$75.72 (first red downside arrow), which in turn, gave perfect points to connect the Fibonacci series (projections) to find the downside projection.
The connection of these three points, shown in charts with a pink line (V-Shape), projected 23.6%(US$71.79), 38.2%(US$70.8), 50.0%(US$69.99), 61.8%(US$69.19), 100.0%(US$66.58).
Post breaking the trendline, the oil prices fell almost till the projected level of US$66.58 (100%).
The daily chart is also making a short-term Death Cross-over (bearish signal), marked with a red contour on the above-shown chart.
However, the prices are currently trading near is 200-days exponential moving average and has taken support previously from the same level, which in turn, could provide support to the crude oil prices.
Disclaimer
This website is a service of Kalkine Media Pty. Ltd. A.C.N. 629 651 672. The website has been prepared for informational purposes only and is not intended to be used as a complete source of information on any particular company. Kalkine Media does not in any way endorse or recommend individuals, products or services that may be discussed on this site. Our publications are NOT a solicitation or recommendation to buy, sell or hold. We are neither licensed nor qualified to provide investment advice.
