


Summary
- Most indices, which previously took a brief hit from the COVID-19 outbreak are now under a recovery mode.
- Many of ASX indices such as S&P/ASX 200 (AXJO), S&P/ASX 200 Information Technology (AXIJ), and S&P/ASX 200 Financials (AXFJ) are showing some interesting developments on charts.
- While AXJO is showing a rising price trend channel, AXIJ has given a break above its medium-term resistance.
- AXFJ has broken out of a triangle formation and currently in a tug-of-war between bulls and bears.
The global market is now under a recovery mode amid improved risk appetite within the global investing community, inferred from improving bond yields across the long-dated T-Bill and the consolidating gold spot market.
Also Read: Gush for Gold; How You Should Plan to Play The Consolidation?
The majority of indices, which previously took a hit from the COVID-19 outbreak and moreover due to the halt in economic activities amidst travel restriction and lockdown across many states, are now under a recovery mode.
Heavy Weights Indices Under Recovery
- S&P/ASX 200
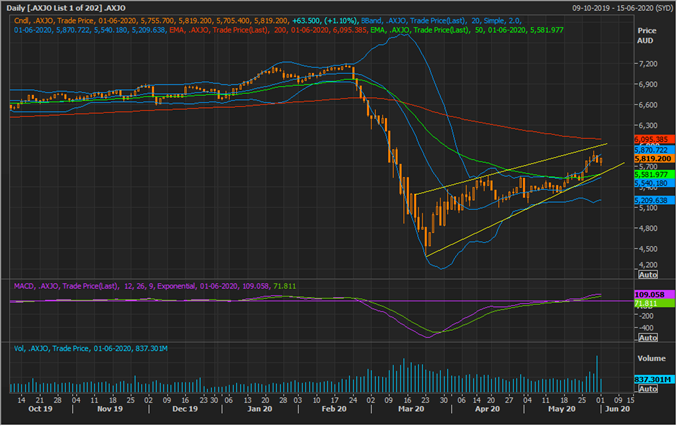
S&P/ASX 200 Daily Chart (Source: EODHD/Others Eikon Thomson Reuters)
On the daily chart, it could be seen that the index is currently under a secondary uptrend after showing a brief fall with prices rising in the pattern of an upward sloping trend channel. In the status quo, the index gave a volatility breakout by breaching the +1 Standard Deviation of the 20-day simple Bollinger band; however, retraced back to establish the resistance point at the upper line of the price trend channel.
Furthermore, the upper line of the trend channel is mapping with the 200-day exponential moving average (or EMA), which in turn, suggests that the upper line of the price trend channel is a major resistance for the index, and a break and sustenance above the same could seed bullish sentiments ahead.
Also, it should be noticed that post giving a volatility breakout, the next trading session was dominated by bears with large volume, suggesting that the upper line zone of the price trend channel is currently the supply zone (bearish zone).
The bottom line of the price trend channel and the 50-day EMA is overlapping (along with the mean value of the Bollinger band), and the index has taken a rebound from the same level quite often, reflecting that the bottom line is a demand zone (bullish zone).
Both sides of the range need to be closely monitored as a break and price action above or below the same would further nurture bullish and bearish sentiments, respectively.
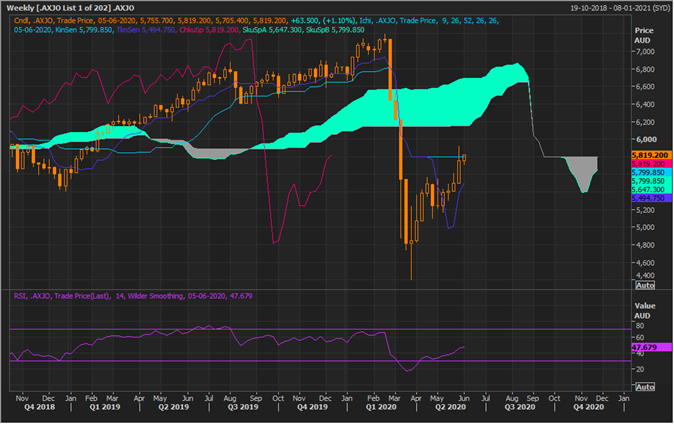
S&P/ASX 200 Weekly Chart (Source: EODHD/Others Eikon Thomson Reuters)
On a longer timescale (weekly chart) it could be seen that the index is currently trading below Span A of the Ichimoku cloud with a negative cross between the conversion line (dark blue) and the base line (sky blue). However, the spread between Span A and Span B is now narrowing down, which is in tandem with the recent price gush, yet, the negative cross between the conversion line and the base line below Span A still reflects bearish sentiments in the market over the longer timescale.
- S&P/ASX 200 Information Technology Index
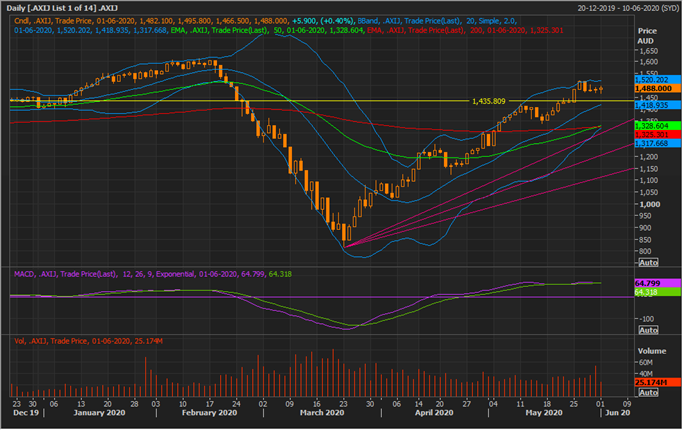
S&P/ASX 200 Information Technology Index Daily Chart (Source: EODHD/Others Eikon Thomson Reuters)
S&P/ASX 200 Information Technology Index had recently breached its medium-term resistance level of 1,435.00 and is currently touching the +1 SD of the 20-day simple Bollinger band.
Furthermore, the pair of medium-term EMAs, i.e., 50- and 200-day EMAs are now crossing each other with short-term EMA (50-day) crossing the medium-term (200-day) EMA from below, reflecting that post crossing the resistance level around 1,435.00, the index has seeded bullish sentiments.
However, post breaching the resistance point the index is now consolidating around the +1 SD of the Bollinger band, but the support for the index looks strong as 50-day EMA, 200-day EMA, and the -1 SD of the Bollinger band are overlapping around the same zone.
Also, post connecting the recent low of the index to its recent high through a Fibonacci fan, it could be seen that the 1/3 fraction of the Fibonacci fan is pointing around the same level; thus, this zone is crucial and should be monitored closely as a price action for few trading session above the same could further boost bullish stance in the index.
The 12,26,9 MACD is currently giving a positive indication, and it should be noticed that while the index has recovered from the deep fall, it is yet to cross the previous high, above which it should continue its primary uptrend.
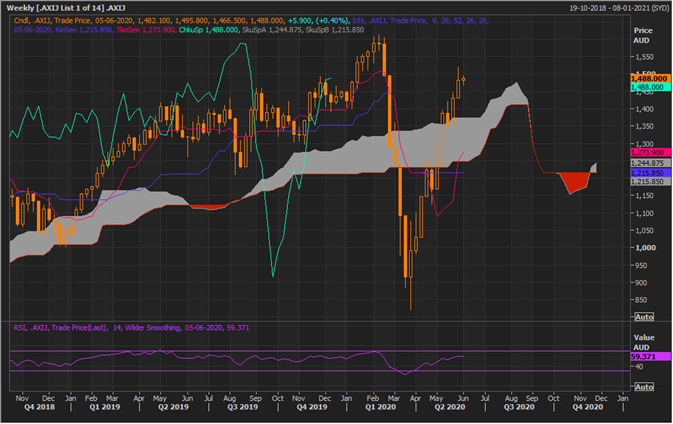
S&P/ASX 200 Information Technology Index Weekly Chart (Source: EODHD/Others Eikon Thomson Reuters)
On the weekly chart, the index is also showing strength with prices crossing the grey cloud area (resistance zone) along with a positive crossover between the conversion line (pink line) and the base line (blue line). Furthermore, the negative spread between Span A and Span B is now turning positive with Span A slipping above Span B.
The grey cloud area should now act as the support for the index, while previous high would still remain the major resistance for primary trend continuation.
- S&P/ASX 200 Financial Index
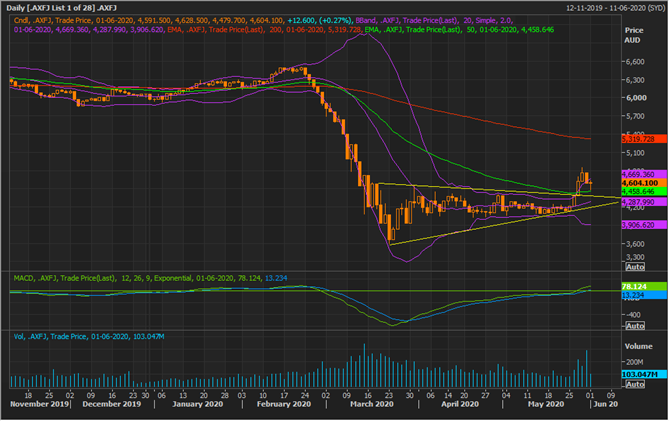
S&P/ASX 200 Financial Index Daily Chart (Source: EODHD/Others Eikon Thomson Reuters)
On the daily chart, the index broke above the triangle formation along with a volatility breakout and is currently playing tug-of-war between bulls and bears to sustain the breakout. In the status quo, the index rose above the 50-day EMA and is currently taking the support of the same level, and as the 50-day EMA and the upper line of the triangle are overlapping it makes it a decisive support.
If the index sustain above the same level, it could further seed bullish sentiments; however, the index could face another resistance at the 200-day EMA. Likewise, failure to do so would attract bears.
While the resistance could be at the 200-day EMA, the immediate support of the index is at the upper line of the triangle, which is overlapping with the 50-day EMA, followed by, the mean value of the Bollinger band, and the bottom line of the triangle, which is currently coinciding with the -1 SD of the Bollinger.
Like the S&P/ASX 200 index, post the volatility breakout, the index witnessed a large bearish candle the next trading day with large volumes, suggesting that the currently zone is the supply zone, and the direction of the index would now depend upon the strength of bulls to absorb the currently supply by bears.
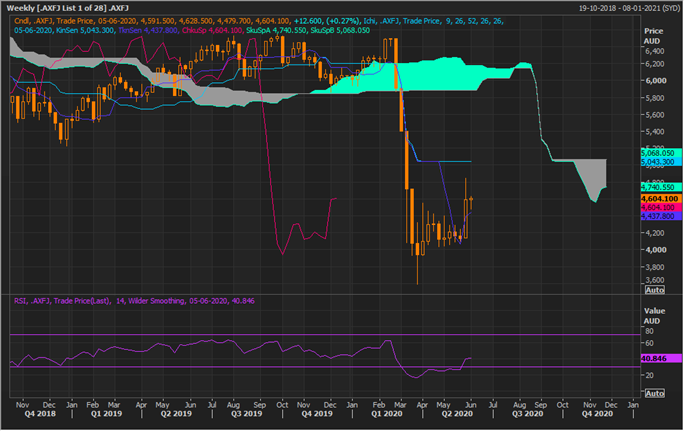
S&P/ASX 200 Financial Index Weekly Chart (Source: EODHD/Others Eikon Thomson Reuters)
However, on the weekly timeframe, the index has a lot to cover and it is yet trading below Span A with a negative cross between the conversion line (dark blue) and the base line (sky blue) with a large negative spread between Span A and Span B.
