


Gold Prices are moving up in the international market amid trade tariff wave started by the United States; the prices of gold spot rose substantially from the level of US$1269.57 (Dayâs low on 21st May 2019) to the level of US$1328.03 (Dayâs high on 03rd June 2019).
After a steep fall from the level of US$1346.79 (High in February 2019) to the level of US$1266.43 (Low in April 2019), gold prices have recovered sharply, supported by the very same factor, which previously dragged the gold prices â The Trade War.
The United States and China instigated round of trade talks to counter the issues of the United States, which circulated around the intellectual property rights, in February 2019, which in turn, exerted pressure on gold prices.
However, despite many rounds of trade talks, no visible outcome came in the limelight, and the United States finally moved against China and raised tariff from 10 per cent to 25 per cent.
China further retaliated and raised the tariff on the U.S. imports, which marked a re-escalation of the bilateral disagreement between the two significant economies.
The tariff ship sailing across the United States did not stop in China, and the tariff tiff recently reached Mexico and India as well, which in turn, raised global growth concerns in the market and supported the gold prices.
On the other hand, dollar prices took a hit from the level of 98.37 (High in May) to the present level of 97.17 (as on 4th June 2019 AEST 2:10 PM), which in turn, shifted the investorsâ attention, which was previously taking the dollar hedge against the trade war, towards gold, which in turn, further added to the gold rally.
Gold on Charts:
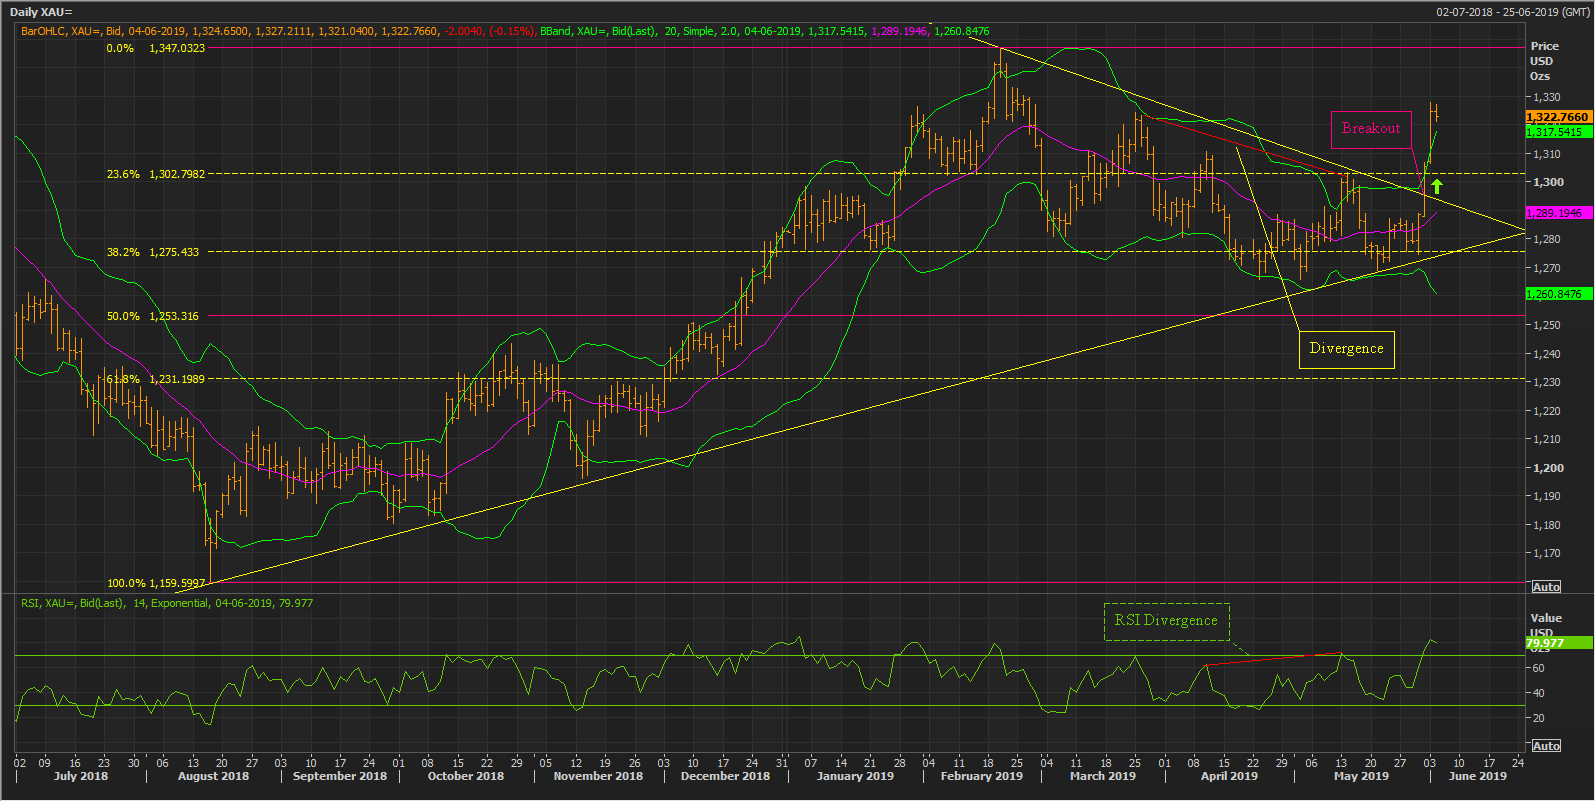 XAU Daily Chart (Source: Thomson Reuters)
After carefully observing the daily chart, we can see that the gold prices have given a recent breakout, and the prices moved post breaching the downward sloping yellow trendline.
The prices crossed the median of the 20-days simple moving average of the Bollinger band and simultaneously breached the resistance of the trendline.
On the indicator perspective, we can observe a divergence between the price actions and the 14-days period Relative Strength Index (RSI). The divergence is when the RSI makes a new high, and the prices are unable to do so. The divergence between the price and 14-days RSI is marked with a red line on the chart shown above.
Three exciting Gold Miners on ASX:
St Barbara Limited (ASX: SBM)
The continuous rise in gold prices for three weeks in a row should offer some advantages to St Barbara Limited (ASX: SBM), which is now surrounded with criticism from retail investors over the timing of its production guidance revision for the financial year 2019.
The company announced on 31st May 2019 that it is downgrading its production guidance from 235,000 to 240,000 ounces of gold to 220,000 ounces for its Gwalia operations, and SBM also reduced the consolidation production guidance from 365,000 to 375,000 ounces to 355,000 ounces, post an institutional placement of $355 million and a retail placement of $135 million.
St Barbara intended to raise $490 million for the proposed acquisition of Atlantic goldâs Moose River prospect.
However, the timing of the announcement to revise the production guidance of the financial year 2019, which would mark a deferred revenue in the financial year 2020, ignited criticism from the retail investors, and to counter the sparked criticism St Barbara provided the retail investors with a withdrawal option.
SBM announced that the applicants who applied for the subscription of the new shares (under the Retail Entitlement Offer) could withdraw the application by 7th June 2019 (AEST 5 PM).
The share prices of the company have taken a jab in the past four months as shares dropped from the level of A$5.152 (High in February 2019) to the level of A$2.480 (Low in May) amid a drop in gold prices and subsequent fundamentals of the company.
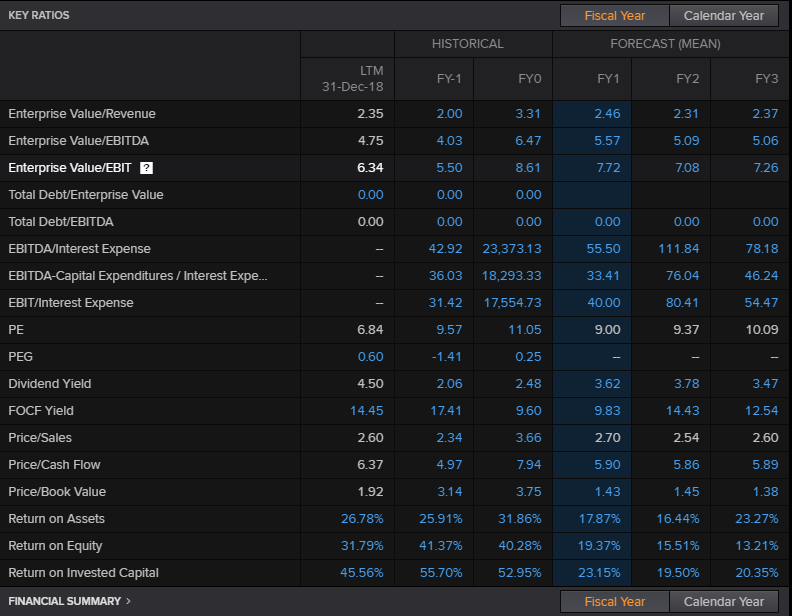
Fundamentals of SBM:
Key Ratios:
 (Source: Thomson Reuters) FY-1 (2017-2018) FY0 (2016-2017)
The company dividend yield declined from 2.48 in FY16-17 to 2.06 in FY17-18 and return on assets fell to 25.91 per cent in FY17-18 from 31.86 per cent in the previous corresponding period (PCP).
 (Source : Thomson Reuters)
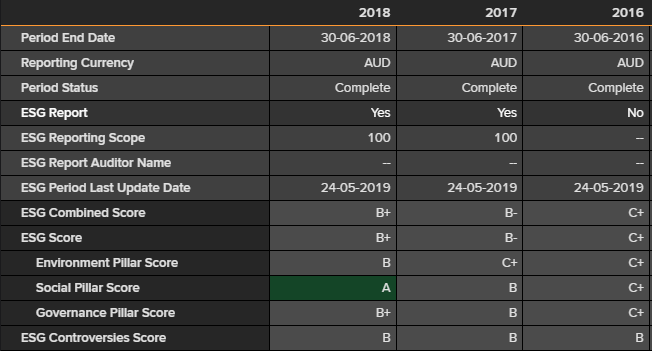
The combined Environmental, Social, and Governance rating of the company improved from B- in FY17 to B+ in FY18 over improved social and environmental factors.
 (Source: Thomson Reuters)
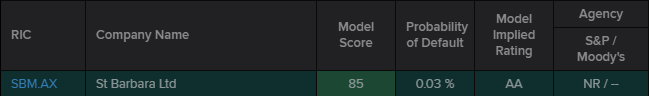
The Thomson Reuters model scored the companyâs credit rating at 85 with a default probability of 0.03 per cent.
Evolution Mining Limited (ASX: EVN)
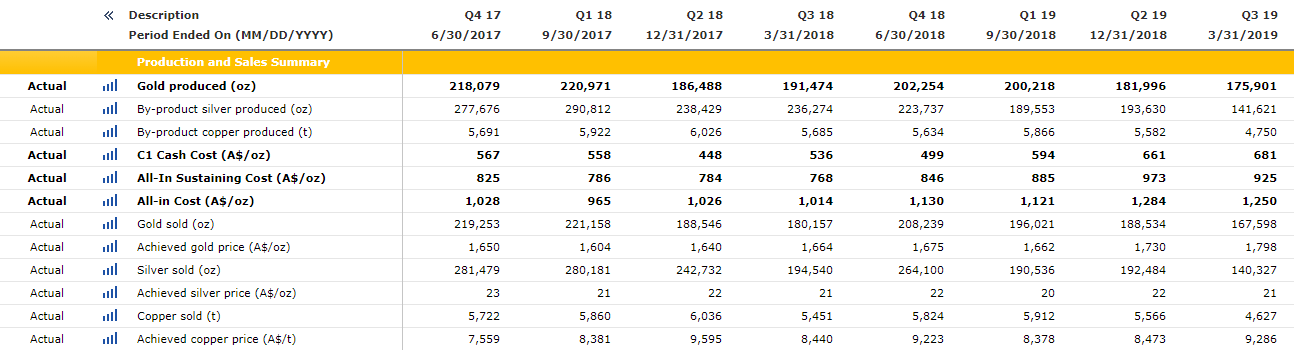
EVNâs operating business assets include Cowal E42 OP, Ernest Henry UG, Mt Carlton OP, MT Rawdon OP, Cracow UG, Mungari OP and UG, and the companyâs divestment includes the Edna May and Pajingo prospects as mentioned by the company in the BAML global metals presentation.
The production capacity of the company declined in the third quarter of the financial year 2019, and the consolidated production of the company fell in the third quarter from 181,996 ounces of gold in the second quarter to 175,901 ounces.
The decline in production along with the lower gold prices from February 2019 to April 2019 was reflected on the share prices of the company, which plunged from the level of A$4.080 (High in February) to the level of A$3.160 (Low in April), a decline of 22.54 per cent.
 Source: Companyâs Website (as on 23rd April 2019)
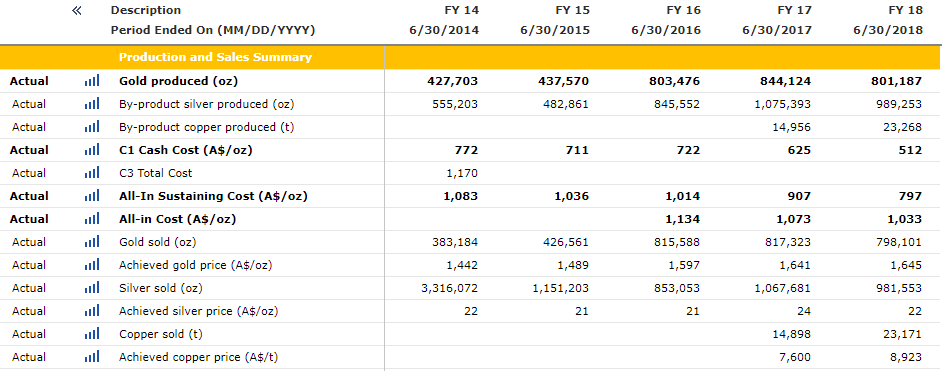
However, in the previous year despite a slight decline in yearly production, the share prices of the company surged on ASX, amid significant recovery in gold, from the level of A$1.982 (Low in January 2017) to the level of A$2.860 (High in January 2018), which marked an increase of approx. 44.30 per cent.
 Source: Companyâs Website (as on 23rd April 2019
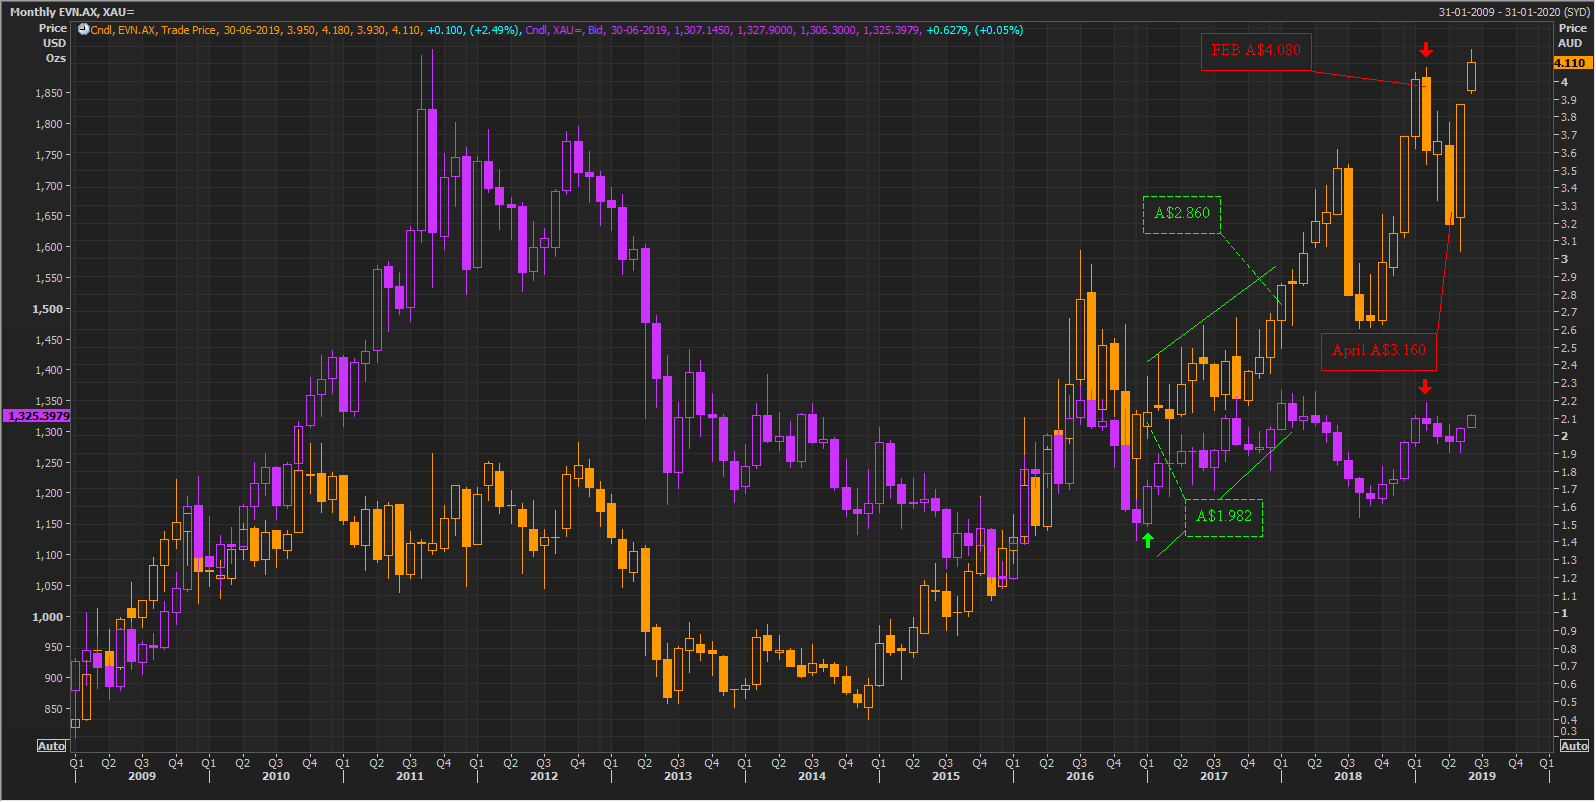 EVN/XAU Comparative Daily Chart (Source: Thomson Reuters)
Post giving a breakout on a daily chart, the share prices of the company rose significantly.
Fundamentals of EVN
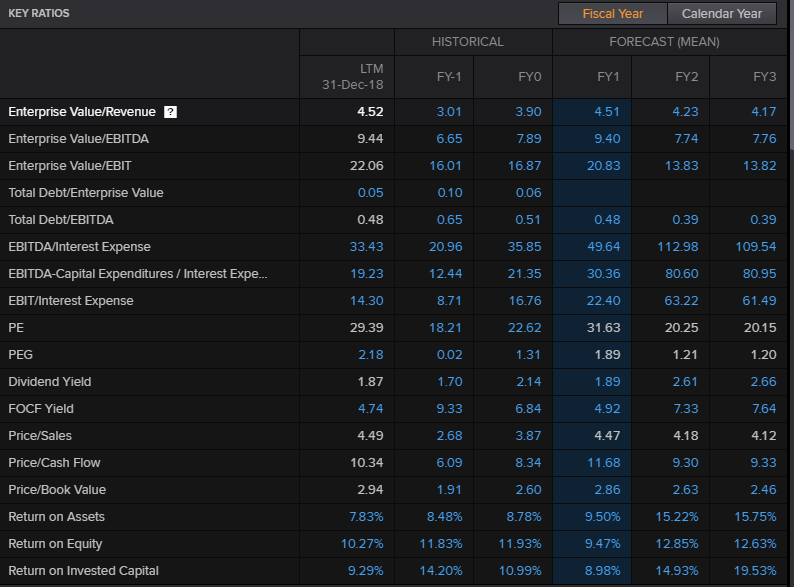
Key Ratios:
 (Source : Thomson Reuters) FY-1 (2017-2018) FY0 (2016-2017)
The companyâs dividend yield declined from 2.14 in FY16-17 to 1.70 in FY17-18 and return on assets fell to 8.48 per cent in FY17-18 from 8.78 per cent in the previous corresponding period (PCP).
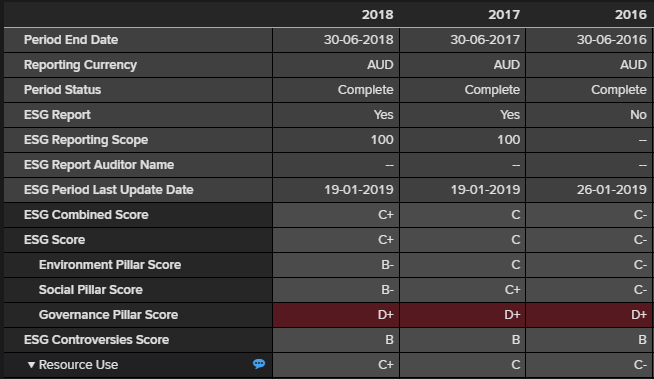
ESG Considerations:
 (Source: Thomson Reuters)
The combined Environmental, Social, and Governance rating of the company improved from C in FY17 to C+ in FY18 over improved social and environmental factors, and governance factor remained compromised.
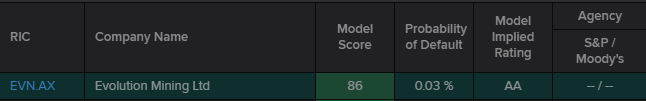
The Thomson Reuters model scored the companyâs credit rating at 86 with a default probability of 0.03 per cent.
Newcrest Mining Limited (ASX: NCM)
In its recent BAML conference presentation, NCM discussed its approach of the value creation strategy for its stakeholders and shareholders.
Newcrest presented that the approach towards the value creation lies in the vision, assets, growth, safety & sustainability, and technology and innovation of the company.
The company improved its total recordable injury frequency rate (per million hours worked) from 3.7 in FY16 to 2.4 in FY18 and same on YTD FY19.
One of the major advanced projects of the company, Cadia has FY19 production guidance of 800-880 kilo ounces of gold and around 90kilo tonnes of copper, while ore reserves of the prospect stand at 22 million ounces of gold and 4.3 million tonnes of copper.
While mineral resources of the prospect are at 38 million ounces of gold and 8.3 million tonnes of copper, the AISC of the prospect stood at $147 per ounce in the third quarter of the FY19.
Apart from Cadia, other significant projects of the company include Lihir, Wafi-Golpu, Gosowong and Telfer.
Newcrest operated on a very low AISC of A$738 per ounce in the recent quarter.
Price Actions:
The share prices of the company improved significantly from the level of A$18.570 (Low in September 2018) to the current month high of 28.750, which marks an increase of approx. 55 per cent.
The share prices of the company are on a continuous surge and uptrend from the level of A$6.960 (Low in December 2013).
With such an increase in share price, NCM has delivered a rate of return of 189.93 per cent in five years, and a rate of return of 34.27 per cent in just one year. The return for six months stands at 37.88 per cent while the return for three months stands at 19.18 per cent.
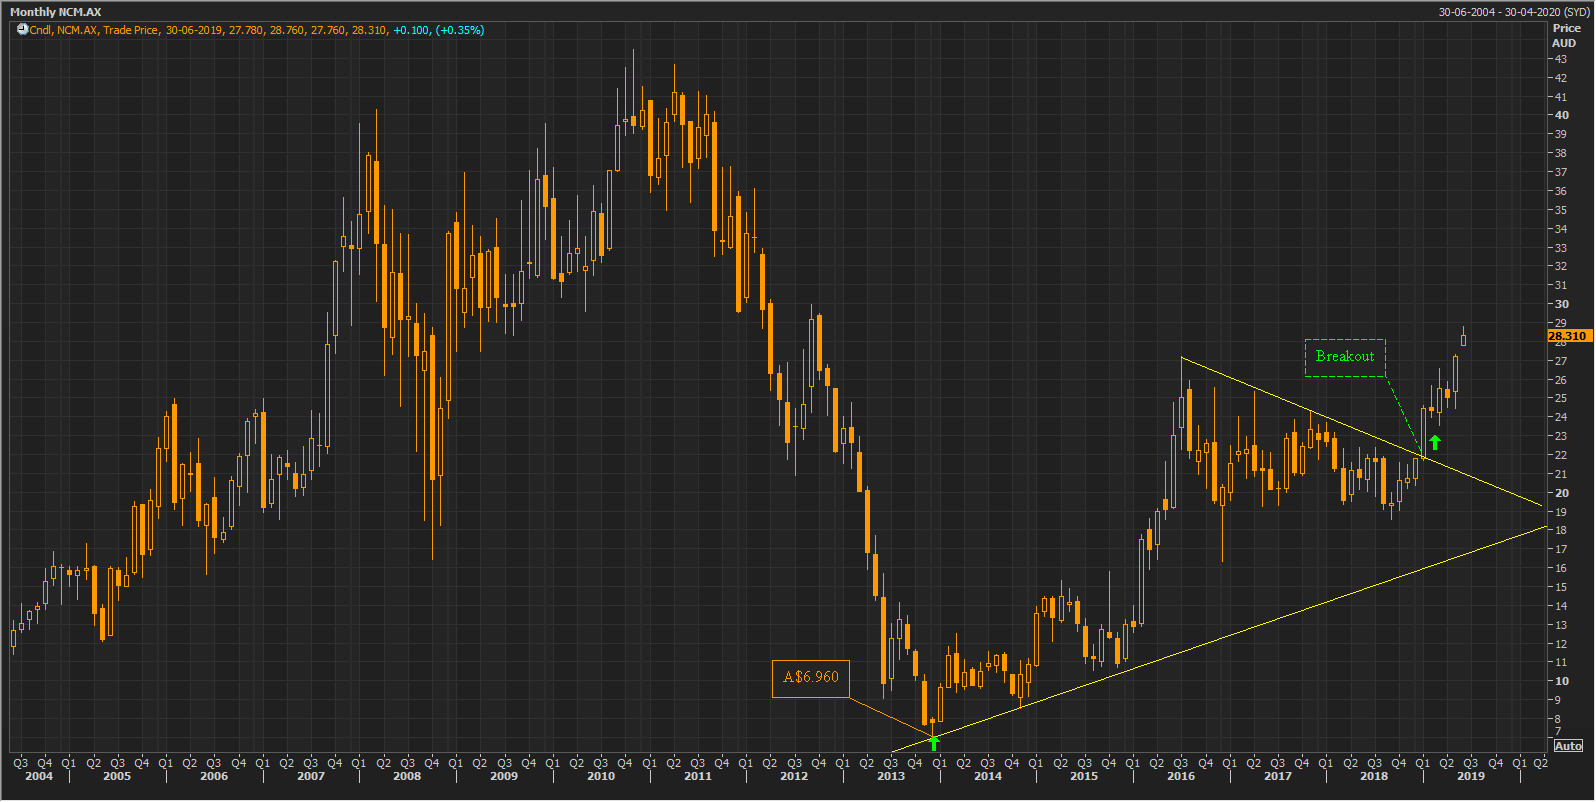 NCM Monthly Chart (Source: Thomson Reuters)
Fundamentals of EVN
Key Ratios:
 (Source: Thomson Reuters) FY-1 (2017-2018) FY0 (2016-2017)
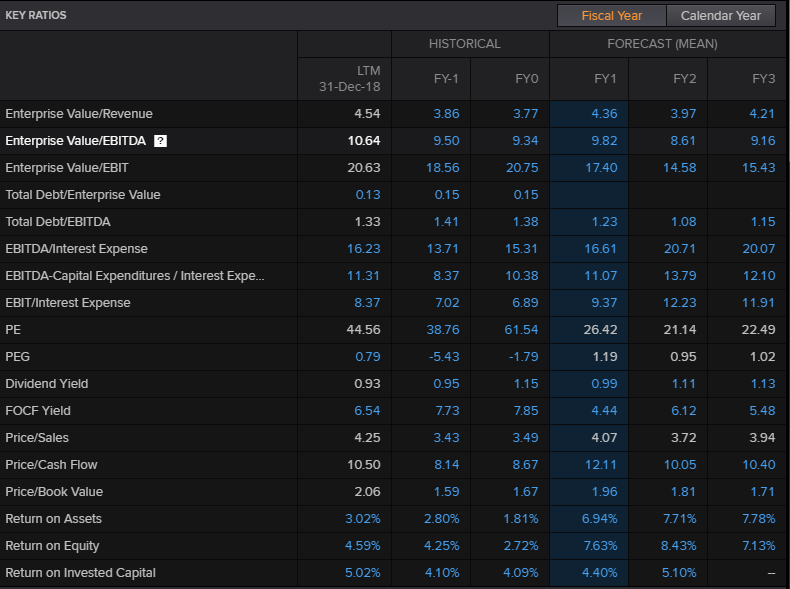
The companyâs dividend yield declined from 1.15 in FY16-17 to 0.95 in FY17-18 and return on assets inched up to 2.80 per cent in FY17-18 from 1.81 per cent in the previous corresponding period (PCP).
ESG Considerations:
(Source: Thomson Reuters)
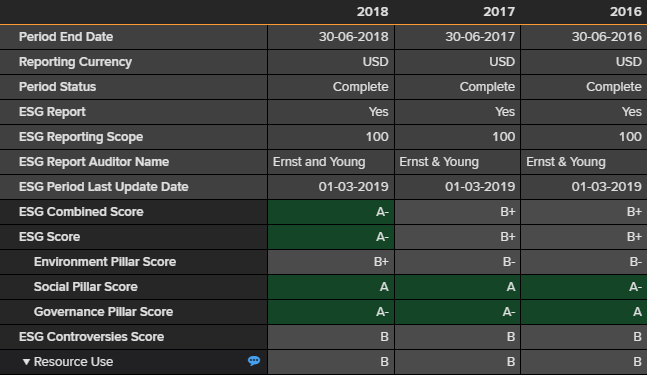
The combined Environmental, Social, and Governance rating of the company improved from B+ in FY17 to A- in FY18 over improved social, environmental and governance factor.
Disclaimer
This website is a service of Kalkine Media Pty. Ltd. A.C.N. 629 651 672. The website has been prepared for informational purposes only and is not intended to be used as a complete source of information on any particular company. Kalkine Media does not in any way endorse or recommend individuals, products or services that may be discussed on this site. Our publications are NOT a solicitation or recommendation to buy, sell or hold. We are neither licensed nor qualified to provide investment advice.
