


_07_03_2026_03_50_21_133108.jpg)

Highlights:
- Net sales of AutoZone, Inc. (AZO) surged over eight per cent YoY in Q1 FY22.
- The net income of Costco Wholesale Corporation (COST) grew in Q1 FY23.
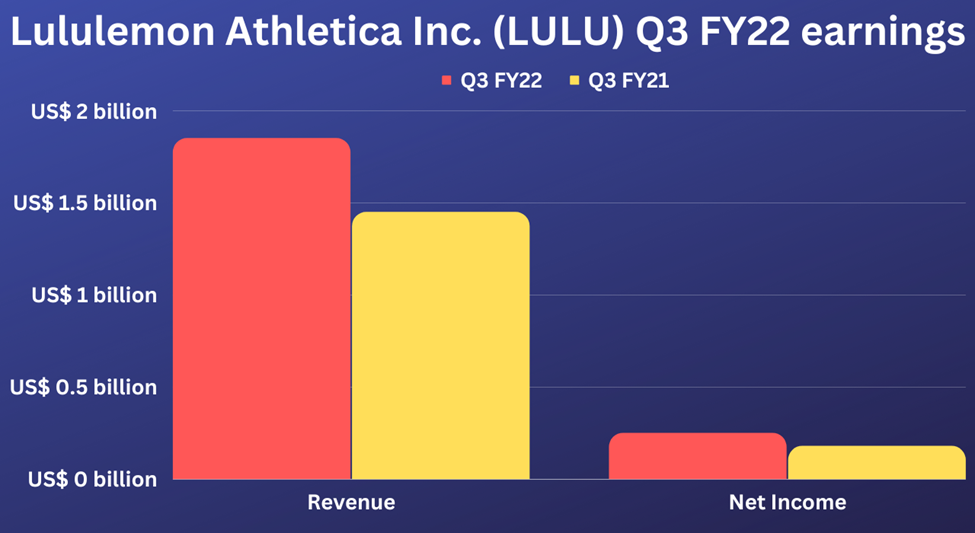
- Lululemon Athletica's revenue surged 28 per cent YoY in Q3 FY22.
The third quarter earnings season has been better so far in 2022. The market also seemed to have recovered from its lows in recent months, after a turbulent walk through the year.
The soaring prices, higher borrowing costs, and other related factors have weighed on corporate profits. In addition, it has also impacted consumers' wallets and investors' sentiments.
Last week, many big companies have posted their earnings. Today we would be exploring three major earnings from last week, which include AutoZone, Inc. (NYSE: AZO), Costco Wholesale Corporation (NASDAQ:COST), and Lululemon Athletica Inc. (NASDAQ:LULU):
AutoZone, Inc. (NYSE:AZO)
The retail firm of automotive parts, AutoZone Inc's P/E ratio is 20.86. The stock of the firm, which sells automotive parts and accessories, surged 18 per cent YTD and about 25 per cent YoY.
The AZO stock was up over 16 per cent QTD and was at its 52-week high of US$ 2,610.05 on December 1, 2022. AutoZone Inc's net sales rose 8.6 per cent YoY to US$ 4 billion in Q1 FY22, while its operating profit declined 4.2 per cent YoY to US$ 723 million.
Costco Wholesale Corporation (NASDAQ:COST)
Another leading retail firm, Costco Wholesale Corporation holds a dividend yield of 0.75 per cent. The stock of the firm, which sells several products like consumer electronics, computers, furniture, etc., fell over 15 per cent YTD and about nine per cent YoY.
The COST stock soared nearly two per cent QTD through December 9. Meanwhile, Costco Wholesale Corporation's net sales rose 8.1 per cent YoY to US$ 53.44 billion in Q1 FY23, and its net income was US$ 1.36 billion, against US$ 1.32 billion in Q1 FY22.
 Source: ©Kalkine Media®; © Canva Creative Studio via Canva.com
Lululemon Athletica Inc. (NASDAQ:LULU)
The leading multinational athletic apparel retailer, Lululemon Athletica Inc's market cap was US$ 44.07 billion. The stock of the Vancouver, Canada-based apparel retailer fell four per cent YTD and about 12 per cent YoY.
The LULU stock added nearly 34 per cent QTD through December 9. In Q3 FY22, Lululemon Athletica Inc's revenue inched up 28 per cent YoY to US$ 1.9 billion, and its diluted EPS was US$ 2 apiece, against US$ 1.44 per share in Q3 FY21.
Bottom line:
The earnings from the companies are closely watched by market participants. It provided them with more insights into how the corporations are performing amid the topsy-turvy scenario in the market.
However, despite the growth noticed in the overall market in recent months, the volatility persists. Any hawkish comments from the policymakers or a negative trend in economic data could trigger another sell-off in the coming times.
So, investors should exercise due diligence with their spending plans and consider all the associated risks of the stock market before investing.
