


John Lewis of Hungerford PLC has cautioned it could consider the scrapping of annual bonuses for its 81,000 employees, as a result of another big fall in profits and further announced the departure of its department store boss. The company had previously announced restructuring of management and said that Paula Nickolds, a veteran and the Managing Director will step down by mutual agreement next month. During her tenure of three-year at the company, the profits dived down from more than £250 million to potentially less than £50 million this year. In addition, the sales of the company fell by 1.8 per cent in the festive season of Christmas. In view of all these, the company, an owner of Waitrose supermarkets as wells as its flagship department store, is said to be considering cancelling the bonuses which were supposed to be paid to the employees. This shall happen for the first time in the last 67 years of its existence.
About John Lewis of Hungerford PLC (LON:JLH)
United Kingdom-based group, John Lewis of Hungerford Plc is a household goods entity, which is into the business of designing, manufacturing, retailing designer kitchens, wardrobes, bedrooms, freestanding furniture and architectural components through direct retailing to customers from its nationwide network of showrooms. Furthermore, the company has its own online platform as a part of its business model, in the name of Just Doors known for replacing kitchen and cabinet doors. The company is known for its specialised kitchen work, bedroom & living space, dressing rooms, furniture and utility rooms and specialised paints with special antiqued finishes, high gloss colours and specialist rubbed colours.
John Lewis of Hungerford PLC Business performance for FY19 period ended 30th June 2019
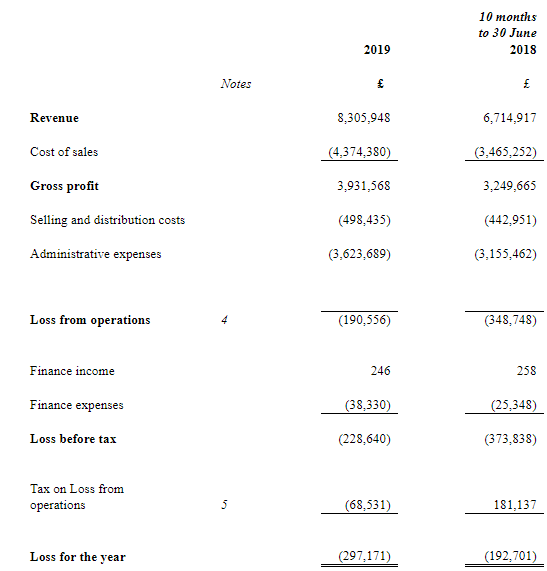
(Source: Companyâs filings, London Stock Exchange)
The company achieved a turnover of £8.3 million for the Financial Year 2019, as compared to the £8.9 million unaudited comparison for the Financial Year 2018. The financial calendar for the company was changed from 31 August to 30 June on a like for like basis, therefore, the previous financial year (2018) was affected by year-end change. In the fiscal year 2018, removing the benefit of two year-end peaks, the comparative turnover was recorded at £8.5 million.
Following a profitable second half year of £127 thousand, the group reported a reduced operating loss of £191 thousand for the full year, reduced from the £318 thousand of loss reported in the Interim results for the first half of the fiscal year 2019 period ended 31st December 2018.
The last one year have tested the groupâs trading performance within an unprecedented retail landscape. Although the economy is not technically in recession, still it feels tougher for retail than the recessions in 1990 and 2008 as compared with the current uncertainty within the economy, mainly resulting from Brexit and structural issues facing retail in the high street.
The company has shutdown many stores. More than 2,800 stores have been shut in the first half of the fiscal year 2019 and numerous restructurings have taken place with respect to finances during the period, with some of the High Street's best-known brands being impacted. Several companies in the kitchen retail sector have been reporting challenges in carrying out businesses.
The companyâs loss for the year can be attributed to a mix of things such as lower margin offerings i.e. prices rising across the supply chain due to inflation and bedroom offerings, the group was unable to pass the impact onto its customers. The company is trying hard to optimise and stamp out the inefficiencies across the entire value chain and increase the level of production.
For the new financial year, the current trading can be best measured by despatched sales and forward orders. Despatched sales and forward orders for the trading of the first 24 weeks stood at £3.8 million in contrast to £4.6 million in the Financial Year 2018. The company has taken a first stage deposit of £1.6 million against future orders in comparison to £1.5 million in the financial year 2018.
The overall design quotation activity of the company was up by 10 per cent within the business in comparison with the previous year which indicates to an underlying latent demand, which is not that evident due to political uncertainty, as a result customers are not able to make decisions.
The company expects more conversions once there is better clarity on Brexit. The company is currently focusing on reducing costs in the business and increasing flexibility to adapt to changing environment and senses the impact on consumer demand shall persist for a while. The management is closely monitoring the situation and devising methods to improve efficiencies in the business as the company shall reap benefits as the confidence level of the consumer improves.
John Lewis of Hungerford PLC -Stock price performance
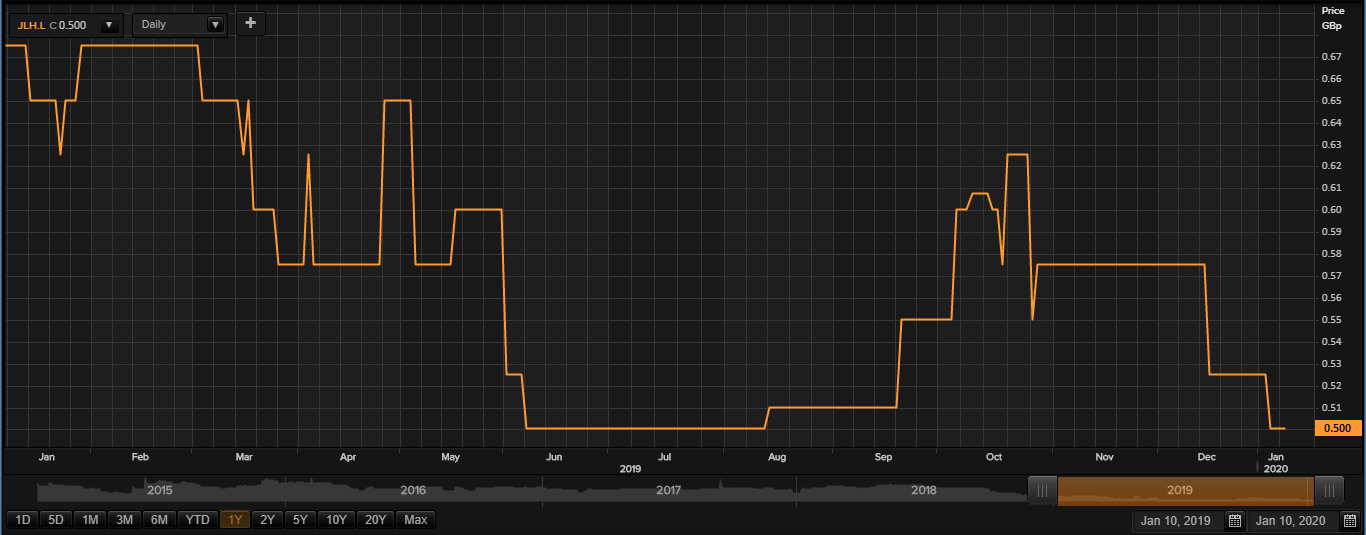
(Source: Thomson Reuters)
On 10th January 2019, while writing at 01:00 PM GMT, John Lewis of Hungerford plc shares were clocking a market price of GBX 0.50 per share, which remained flat in comparison to the last traded price of the previous day. The companyâs market capitalisation was at £936.01 thousand at the time of writing.
On 30th January 2019, the shares of John Lewis of Hungerford plc have touched a new peak of GBX 0.75 and reached the lowest price level of GBX 0.43 on 12th July 2019 in the last 52 weeks. The companyâs shares were trading at 33.33 per cent lower from the 52-week high price mark and 16.28 per cent higher than the 52-week low price mark at the current trading level, as can be seen in the price chart.
The stockâs 5-day average daily traded volume was 107,037.80; 30 daysâ average daily traded volume- 76,683.17 and 90 daysâ average daily traded volume â 61,627.20. The volatility of the companyâs stock is lower as compared with the index taken as the benchmark, as the beta (5Y monthly) of the companyâs stock was recorded at 0.24.
The shares of John Lewis of Hungerford plc have delivered a negative return of 16.67 per cent in the last quarter. The companyâs stock plunged by 4.76 per cent from start of the year to till date. The companyâs stock has given investors 25.93 per cent of a negative return in the last year.
