


Dividends have lesser volatility as compared to earnings; this can be said to be true once a company decides to start paying a certain amount to its shareholders as cash dividends and as a result the share price exhibits less volatility in the market. Therefore, long term investors with lower risk appetite can play on dividend stocks for regular income or can reinvest dividends for cumulative growth. Here are insights about four stocks Imperial Brands PLC, SSE Plc, British American Tobacco PLC and WPP Plc to consider for longer time horizon with comparatively less volatility.
Comparative price chart for IMB, SSE, BATS, WPP
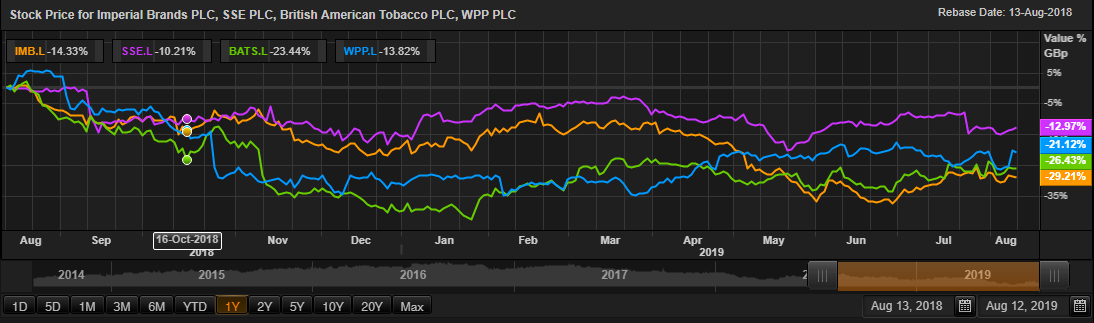
(Source: Thomson Reuters)
Imperial Brands PLC
Imperial Brands Plc (IMB), is a fast-moving consumer goods (FMCG) company with a core business built around the tobacco portfolio. The company offers a comprehensive range of cigarettes, fine cut and smokeless tobaccos, papers and cigars and is increasingly focussed on developing and expanding itâs Next Generation Products (NGP) portfolio.
Recent developments
On 25th July 2019, the company made its biggest investment in the cannabis sector with a $123 million deal signed with the Canadian company Auxly Cannabis Group. The deal comprises a research and development partnership, and Auxly will get international licences to the British tobacco giant's vaping technology.
Financial Highlights (H1 FY2019, £million)
Driven by a good underlying tobacco performance and strong growth in Next Generation Products portfolio, net revenue was up 2.5 per cent at constant currency to £3,656 million, while the revenues from the tobacco segment was down by 0.4 per cent, the revenues from NGP segment was up 2.9 per cent as compared to H1 FY2018. Due to lower amortisation expenses during the period, operating profit surged by 38.1 per cent to £1,150 million, while adjusted operating profit declined by 2.3 per cent at constant currency and 0.2 per cent at actual rates to £1,620 million in H1FY2019 as compared to same period last year. Reported basic EPS was up by 38 per cent to 71.2 pence, while adjusted earnings per share of 115.6 pence, up by 1.1 per cent at actual rates and down by 1.3 per cent at constant currency in the H1FY2019 as compared to H1 FY2018. The board of the IMB has declared an interim dividend per share of 62.56 pence, which was 10 per cent higher on a Y-o-Y basis. The dividend will be paid in two parts of 31.28 pence each.
The group is expected to exploit opportunities in the tobacco arena, where it seeks to deliver high margin revenue growth through a focus on its longstanding brands and market priorities. The group has mentioned that the company is on track to report further deleverage in the full year. Also, the group has established its new generation products (NGP) portfolio under brand "Blue" which it intends to push into retail channels in Britain, Ireland, Germany, France, Japan, Spain and Italy.
In the first half of the current financial year, Imperial Brands has reported strong results, with an increased focus on establishing NGP. Increased focus on establishing NGP has yielded positive results for the company as its performance was enhanced by the growing contribution of the NGP business.
IMB Share Price Performance
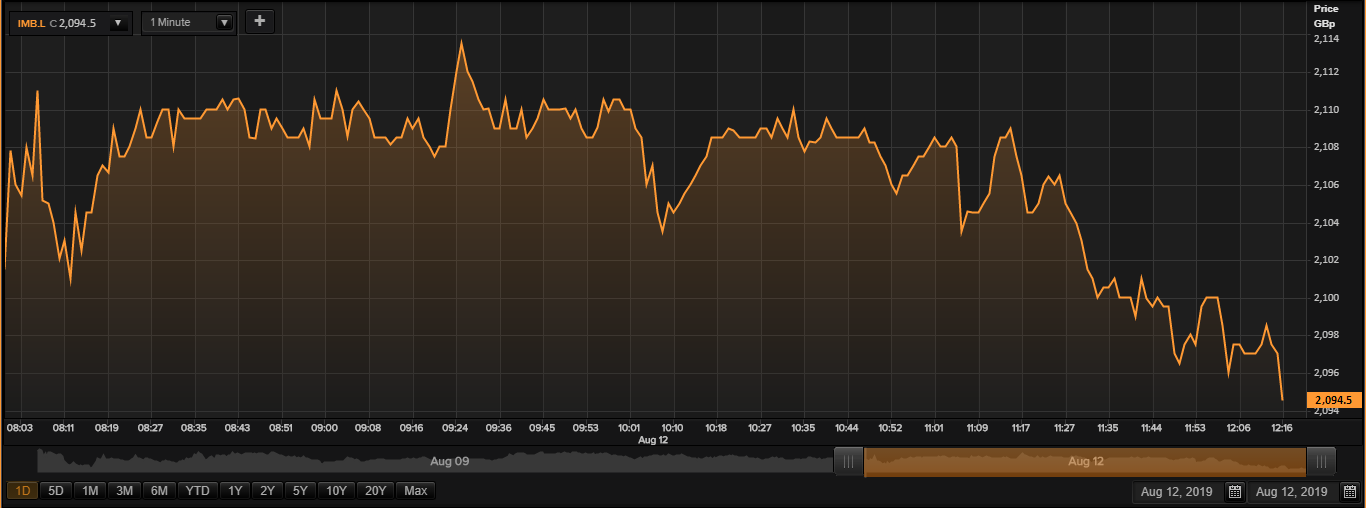
Daily Chart as at 12th August 2019, before the market close (Source: Thomson Reuters)
On 12th August 2019, at the time of writing (before the market close, GMT 12:40 PM), Imperial Brands PLC shares were trading at GBX 2,094.5, down by 0.47 per cent as compared with the previous dayâs closing price. Stock's 52- week High is GBX 3,009, and 52-week Low is GBX 1,821.40. The groupâs stock beta stood at 1.10 as on date, reflecting higher volatility as compared to the benchmark index.
In the past 1 year, IMB shares have delivered a negative return of 29.25 per cent. Also, on a YTD (Year-to-Date) basis, the stock has plunged by approximately 11.46 per cent and was down by 5.52 per cent in the last three months with an overall gross dividend yield of 10.54 per cent.
The company has been consistent in paying dividends to investors. In the last seven years, the companyâs highest dividend yield has been of 7.03 per cent (FY18), while its lowest has been of 3.91 per cent (FY16). The mean annual dividend yield was around 5 per cent in the past seven years.
SSE Plc
SSE Plc (SSE) is an integrated energy utility company. It develops, owns and operates energy and related infrastructure and services. The company generates, transmits, distributes, and supplies electricity; and produces, stores, distributes and supplies gas. SSE produces electricity in gas- and oil-fired, renewable, coal-fired, and multi-fuel plants; and gas from gas fields in the North Sea. It has interests in electricity transmission businesses in the north of Scotland, electricity distribution in the north of Scotland and southern central England, and gas distribution in Scotland and southern England.
Financial Highlights â Financial Year 2019 (£, million)
For the financial year ending 31st March 2019, the companyâs revenues stood at £7,331.6 million as against £27,250.4 million in FY2018. The companyâs revenues declined sharply by 73 per cent due to a significant decline in the revenue from the companyâs wholesale businesses. The companyâs total gross profit stood at £1,545 million in FY2019 versus £2,276.8 million in FY2018. The companyâs adjusted operating profit stood (continuing operations) at £979.5 million in FY2019 as against £1,400.2 million in FY2018. The total operating profit (continuing operations) for FY2019 was at £1,692.2 million as against £1,157.4 million in FY2018. The companyâs reported PBT (profit before tax) stood at £1,370.6 million in FY19, which was up by 59 per cent from that in the previous year. The companyâs adjusted PBT (profit before tax) stood at £725.7 million, which was down by 38 per cent from the previous year. The companyâs reported EPS (earnings per share) stood at 135.2 pence per share, which was up by 110 per cent from the previous year. The companyâs adjusted EPS (earnings per share) stood at 67.1 pence per share, which was down by 32 per cent from the previous year.
SSE Share Price Performance
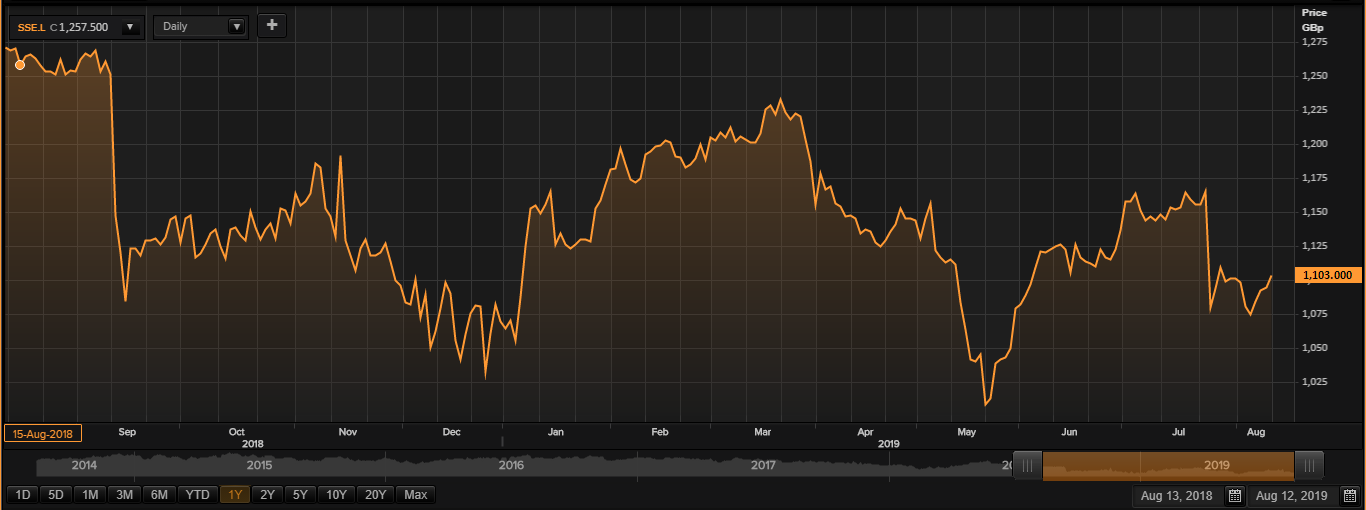
Daily Chart as at 12-August-19, before the market close (Source: Thomson Reuters)
On 12th August 2019, at the time of writing (before the market close, GMT 1:23 PM), SSE Plc shares were trading at GBX 1,103, up by 0.77 per cent against the previous dayâs closing price. Stock's 52- week High and Low are GBX 1,287.00/GBX 997.80. The groupâs stock beta stood at 0.62 as on date, reflecting lower volatility as compared to the benchmark index.
In the past 1 year, SSE PLC shares have delivered a negative return of 14.49 per cent. On a YTD (Year-to-Date) basis, the stock surged by approximately 1.2 per cent and was down by 1.93 per cent in the last three months with an overall gross dividend yield of 8.91 per cent.
The company has been consistent in paying dividends to investors. In the last seven years, the companyâs highest dividend yield had been of 8.21 per cent (FY19), while its minimum dividend yield had been of 5.67 percent (FY13). The mean annual dividend yield was around 6.46 per cent in the past seven years.
British American Tobacco PLCÂ
British American Tobacco PLC (BATS) is a London, United Kingdom-headquartered multinational tobacco and next-generation products company. The company is one of the world's biggest consumer goods companies and merchandises its products in more than 200 countries worldwide, covering six continents, and is the market leader in more than 50 countries. The four geographical segments are the reportable segments for the company, designated as United States, Europe and North Africa (ENA), Asia-Pacific and Middle East (APME) and Americas and Sub-Saharan Africa (AMSSA).
Â
Financial Highlights (H1 FY2019, £million)
The companyâs revenue increased by 4.6 per cent in H1 FY19 to £12,170 million as compared to the corresponding period of the last year, with revenue from the strategic portfolio moving up by 8.7 per cent. Adjusted revenue rose by 5.3 per cent to £12,139 million, while on constant rates, adjusted revenue increased by 4.1 per cent, due to price/mix and increase in new categories.
Profit from operations declined by 1.3 per cent in H1 FY19 to £4,380 million as compared to H1 FY18, and the operating margin declined over 210 bps, with the corresponding number on a representative basis increasing by 8.1 per cent to £5,209 million (adjusted profit). Adjusted operating margins were higher by 110bps. Adjusted diluted EPS rose by 8.8 per cent to 149.3 pence as compared to the corresponding period of the last year.
In 2019, adjusted net debt to EBITDA is projected to decline by around 0.4x from 2018. The next quarterly dividend per share of 50.75 pence will be paid in August 2019, as part of the earlier announced dividend per share of 203 pence, which is payable in four equal instalments.
BATS Share Price Performance
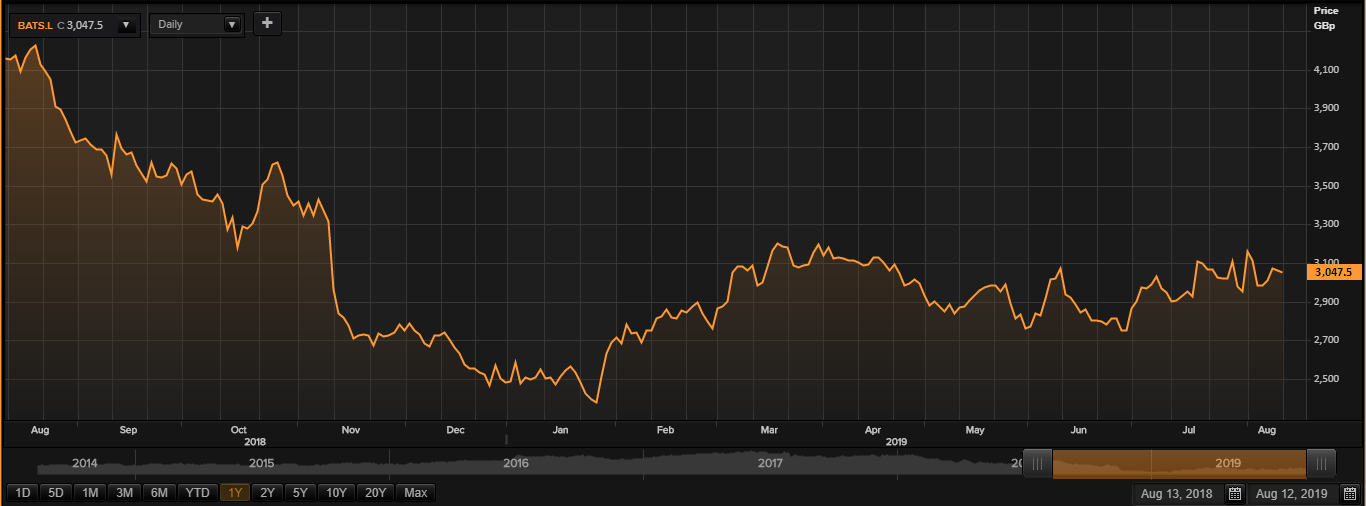
Daily Chart as at 12-August-19, before the market close (Source: Thomson Reuters)
On 12th August 2019, at the time of writing (before the market close, GMT 1:38 PM), BATS shares were trading at GBX 3,047.5, down by 0.31 per cent against the previous dayâs closing price. Stock's 52- week High and Low prices are GBX 4,240.00/GBX 2,249.00. The groupâs stock beta stood at 1.32 as on date, reflecting higher volatility as compared to the benchmark index.
In the past 1 year, BATS shares have delivered a negative return of 27.11 per cent. On a YTD (Year-to-Date) basis, the stock surged by approximately 22.28 per cent and was up by 5.94 per cent in the last three months with an overall gross dividend yield of 6.58 per cent.
The company has been consistent in paying dividends to investors. In the last seven years, the companyâs highest dividend yield had been of 7.81 per cent (FY18), while its minimum dividend yield had been of 1.99 per cent (FY17). The mean annual dividend yield was around 4.35 per cent in the past seven years.
WPP PlcÂ
WPP Plc (WPP) is a British holding company headquartered in London, United Kingdom. The group offers national and multinational clients a comprehensive range of communications services and is organised into four reportable segments: Global Integrated Agencies, Data Investment Management, Public Relations, and Specialist Agencies â which includes WPP Digital and direct, digital & interactive. The company has now become the world leader in communications, commerce and technology domain and employs more than 130,000 personnel across 112 countries.
Financial Highlights (H1 FY19, £million)
In H1 FY19, the companyâs reported revenue increased by 1.6 per cent to £7,616 million as compared with the corresponding period of the last year, while LFL sales were down by 0.6 per cent. Reported revenue less pass-through costs stood at £6,149 million and remained flat against the same period of the previous year. LFL revenue less pass-through costs decreased by 2 per cent. Reported headline EBITDA reduced by 7.7 per cent to £875 million against the £948 million in H1 FY18, while headline EBITDA decreased by 8.9 per cent at a constant currency basis. Headline operating margin stood at 11.9 per cent. Reported profit before tax was £478 million in H1 FY19, a decrease of 43.5 per cent from the same period of the last year. The PBT was down because of the exceptional gain that has not been reported and a charge on the revaluation of financial instruments against the credit in 2018. Reported headline diluted EPS reduced to 34.2 pence against the 42.6 pence in H1 FY18, while diluted EPS was 24.8 pence. Average net debt reduced by £709 million to £4.384 billion against the first half of previous yearâs data. Interim dividend per share was 22.7 pence and remained constant from the previous year same period.
WPP Share Price Performance
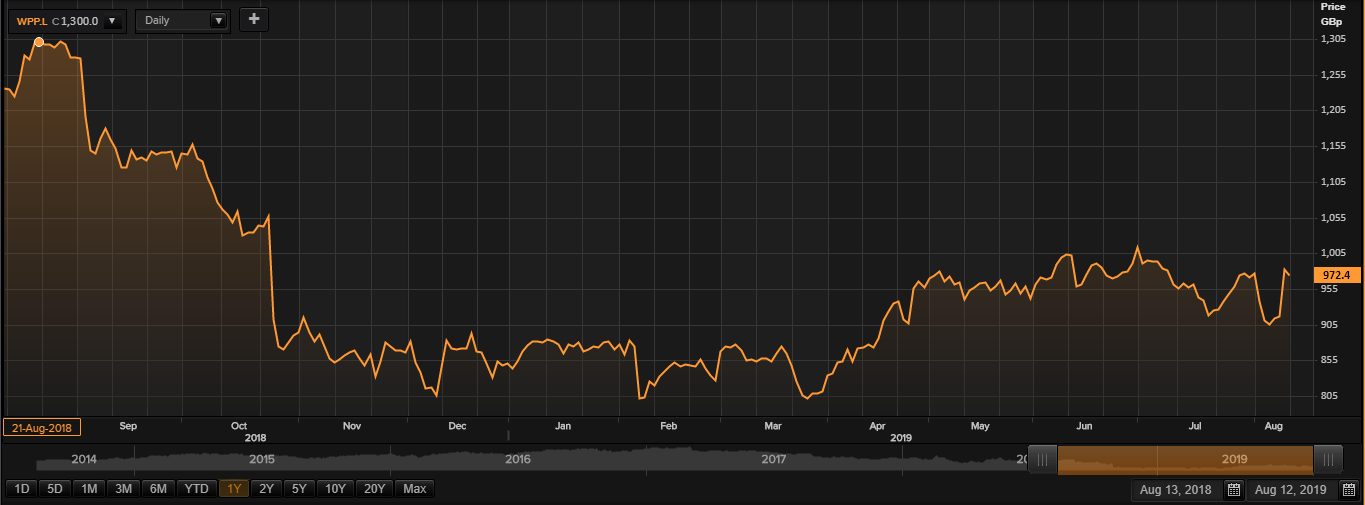
Daily Chart as at 12-August-19, before the market close (Source: Thomson Reuters)
On 12th August 2019, at the time of writing (before the market close, GMT 1:43 PM), WPP shares were trading at GBX 972.4, down by 0.87 per cent against the previous dayâs closing price. Stock's 52- week High and Low are GBX 1,323.50/GBX 791.00. The groupâs stock beta stood at 1.17 as on date, reflecting higher volatility as compared to the benchmark index.
In the past 1 year, WPP shares have delivered a negative return of 19.43 per cent. Also, on a YTD (Year-to-Date) basis, the stock surged by approximately 15.88 per cent and was up by 2.21 per cent in the last three months with an overall gross dividend yield of 6.12 per cent.
The company has been consistent in paying dividends to investors. In the last seven years, the companyâs highest dividend yield had been of 7.09 per cent (FY18), while its minimum dividend yield had been of 2.48 per cent (FY13). The mean annual dividend yield was around 3.72 per cent in the past seven years.
