


Sports Direct International PLC
Established in 1982, headquartered in London, the United Kingdom, Sports Direct International PLC (SPD) is a well-known retail chain and supplier of retails sports, footwear, leisure clothing, apparel and equipment products through a network of retail stores and online channels. It engages in five segments: European Retail, Wholesale & Licensing, UK Sports Retail, Rest of World Retail, and Premium Lifestyle. The companyâs business operations are spread across in more than 20 countries and a total headcount of more than 26,000 staff. The company has around 490 plus stores in the United Kingdom and Northern Ireland, 220 plus stores in Europe, 25 plus stores in Malaysia, 40 plus stores in the United States and about 30 plus premium stores.
SPD-Recent News
The company recently released a statement that it does not intend to bid for Goals Soccer Centres plc as it was unable to complete due diligence required to progress the offer.
SPD-Financial highlights for FY19
For the financial year ending 28th April 2019, the companyâs revenue surged by 10.2 per cent to £3,701.9 million in FY19 from £3,359.5 million in FY18. The companyâs revenue from UK Sports Retail plunged by 1.9 per cent in FY19. The companyâs European Sports revenue plunged by 5.9 per cent in FY19. Due to an increased portfolio in stores and online sales, the Premium Lifestyle Retail revenue surged by 26.3 per cent to £204.8 million in FY19 as against £162.1 million in FY18. Due to price resetting, increased inventory provisions and acquisition of Bob's Stores and Eastern Mountain Sports in the previous years, the companyâs gross margin surged to 42.8 per cent in FY19 from 39.7 per cent in FY18. The companyâs underlying EBITDA plunged by 6 per cent to £287.8 million in FY19. The companyâs free cash flow (pre-capex) was down to £273.3 million in FY19 as against £326.2 million in FY18. The companyâs profit before taxation (reported) was up by 193.3 per cent to £179.2 million in FY19 from £61.1 million. The companyâs profit before taxation (underlying) surged by 5 per cent to £143.3 million in FY19 from £136.5 million (restated). The companyâs earnings per share (reported) surged by 468.4 per cent to 21.6 pence in FY19 from 3.8 pence. The companyâs basic earnings per share (underlying) plunged by 7.9 per cent to 17.6 pence in FY19. The companyâs profit after taxation (reported) was up by 400 per cent to £116.0 million in FY19 from £23.2 million. The companyâs profit after taxation (underlying) was recorded at £91.5 million in FY19 from £100.6 million in FY18. The companyâs net debt plunged to £378.5 million by the end of the fiscal year 2019 as against £397.1 million at 29th April 2018.
SPD-Share price performance
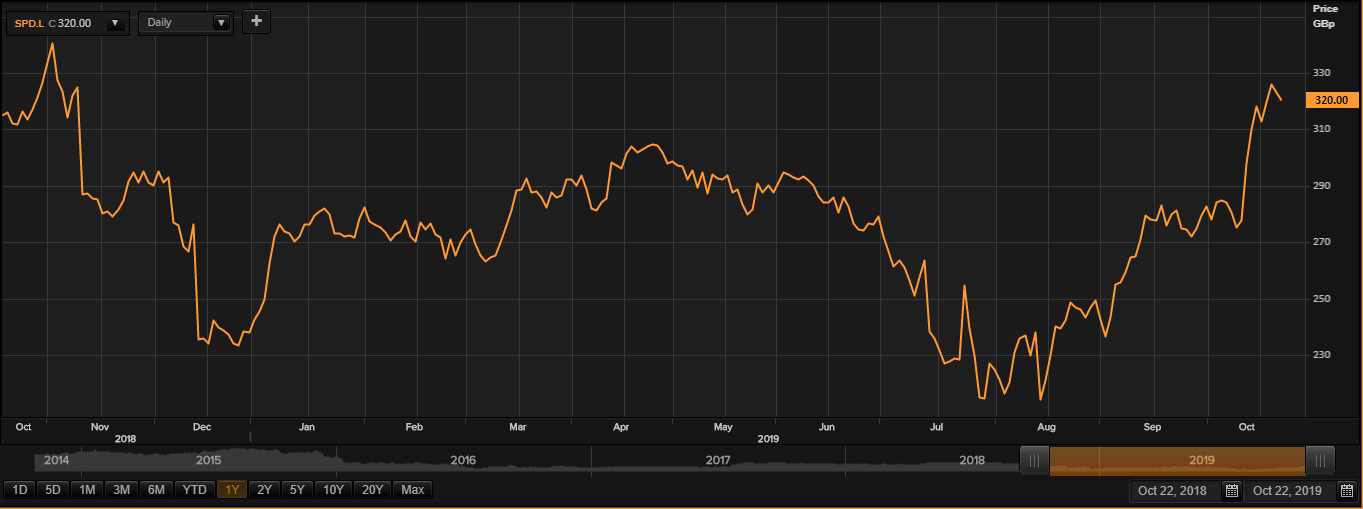
(Source: TR)
At the time of writing (22/10/19 before the market close, at 03:28 PM GMT), shares of the SPD were trading at GBX 320 and plunged by 0.92 per cent against the previous day closing price.
Volume Summary
The 5-day average daily shares that exchanged hands stood at 790,497.60, which was around 8.20 per cent above the 30-day average daily volume (730,527.40) that exchanged hands at the London Stock Exchange. Todayâs volume in the stock stood at 200,733 with 372 trades taking place at the London Stock Exchange (before the market close).
52wk H/L range
In the past 52-wks, shares of the SPD have registered a high price of GBX 346 and a low price of GBX 166.60, and at the current trading level, as quoted in the price chart, shares were quoting around 92.07 per cent above the 52w low price level.
Price Performance (%)
On a YoY basis, shares of SPD have delivered a positive price return of 2.57 per cent and the benchmark index by approximately 0.94 per cent up over the same period. However, on a year-to-date basis, the stock has recorded a positive price return of approximately 35.83 per cent and was up by around 15.52 per cent in the past one month.
Simple Moving Average (SMA)
From the Simple Moving Average standpoint, shares were quoting above the 200-day simple moving average price and were quoting above its 60-day and 30-day SMA prices as well.
Relative Strength Index (RSI)
The 30-day and 14-day relative strength index were strengthening at 65.72 and 73.03, respectively.
Ferrexpo PLC
Ferrexpo Plc (FXPO) is a Swiss-based iron ore mining company. It is involved in the production, processing and export of iron ore pellets. The companyâs assets are established in the Poltava region of Ukraine.
FXPO-Production Report
For the reported period, the companyâs total pellet production increased by 1.7 per cent against the 9M 2018 total pellet production. For the 9M 2019, the production of high quality 65 per cent Fe pellets surged by 4.2 per cent against the 9M 2018.
FXPO-Financial highlights for H1 FY19
In the first half of the financial year 2019, the companyâs sales volume increased by 4 per cent to 4,990 kt as compared with the corresponding period of the last year. The groupâs reported revenue increased by 28 per cent to US$787 million as compared to US$617 million in H1 FY18, reflecting a surge in sales volumes and higher iron ore fines prices. The underlying EBITDA rose by 59 per cent to US$372 million against the previous year same period data, due to an increase in sales volumes. Profit after tax for the period increased by 78 per cent to US$270 million against US$152 million in H1 FY18, driven by lower interest expense and higher profit before tax and finance. Basic earnings per share (EPS) increased to US$45.9 cents as compared to US$25.9 cents in H1 FY18. The interim declared dividend per share rose by 100 per cent to US$6.6 cents, due to increased capital investment and continued debt reduction. Net debt stood at US$282 million, a decrease of 24 per cent as compared to US$369 million in H1 FY18.
FXPO-Share price performance
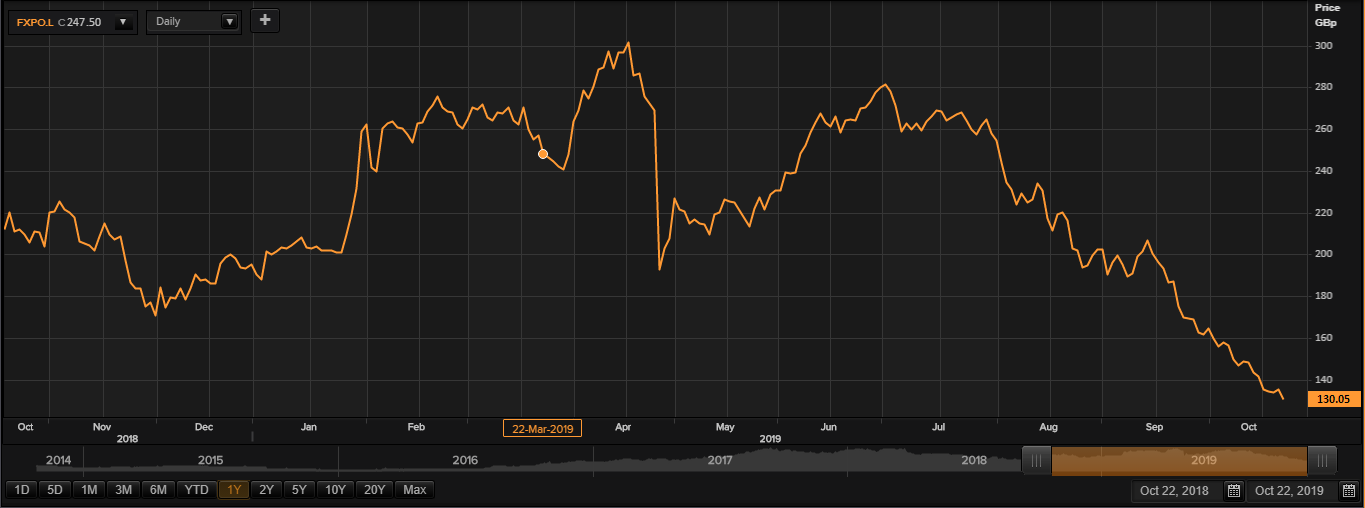
(Source: TR)
At the time of writing (22/10/19 before the market close, at 03:11 PM GMT), shares of the FXPO were trading at GBX 130.05 and plunged by 3.55 per cent against the previous day closing price.
Volume Summary
The 5-day average daily shares that exchanged hands stood at 3,917,742.00, which was around 25.99 per cent above the 30-day average daily volume (3,109,506.93) that exchanged hands at the London Stock Exchange. Todayâs volume in the stock stood at 1,527,474 with 870 trades taking place at the London Stock Exchange (before the market close).
52wk H/L range
In the past 52-wks, shares of the FXPO have registered a high price of GBX 304.57 and a low price of GBX 129.95, and at the current trading level, as quoted in the price chart, shares were quoting around 0.07 per cent above the 52w low price level.
Price Performance (%)
On a YoY basis, shares of FXPO have delivered a negative price return of 36.34 per cent and the benchmark index by approximately 37.35 per cent down over the same period. However, on a year-to-date basis, the stock has recorded a negative price return of approximately 30.72 per cent and was down by around 27.81 per cent in the past one month.
Simple Moving Average (SMA)
From the Simple Moving Average standpoint, shares were quoting below the 200-day simple moving average price and were quoting below its 60-day and 30-day SMA prices as well.
Relative Strength Index (RSI)
The 30-day and 14-day relative strength index stood at 27.16 and 20.33, respectively.
