


Compass Group PLC
The Compass Group PLC (Identifier: CPG) is a British Multinational organization situated in Chertsey, Surrey, and is the biggest contract foodservice organization globally. The organisation was established in the UK as 'Industrial facility Canteens Ltd', and in 1987, in the wake of changing hands a few times, the board purchase out of the agreement services division of Compass Services from Grand Metropolitan. It gives nourishment and provides services to a wide scope of customers, from military to students, in excess of 50 nations and gives 5.5 billion suppers to office laborers. As on February 02, 2001, the companyâs stocks got listed on the main market of the London Stock Exchange.
CPG-Trading Update Q3 FY2019
Driven by the decent performance of the company in North America, the group is eying for an organic revenue growth in between 4-6 per cent range for the full-year 2019. However, the gross margin is estimated to remain flat against the previous financial year. During the three months under consideration, the company recorded an organic growth of 6.3 per cent, primarily led by decent revenue growth in North America with improving the performance of the company in Rest of World. For the nine months ended as on June 30, 2019, the groupâs organic revenue was up by 6.5 per cent against the comparing period of the corresponding financial year. Compass Group Plc will announce its full-year results on 26th November 2019.
CPG-Financial Highlights for H1 FY19
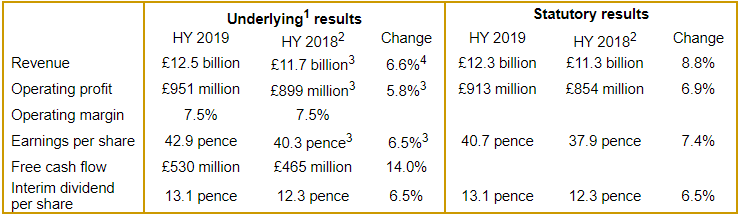
(Source: LSE filings)
For the first half of the financial year 2019, the companyâs underlying revenue was up by 6.6 per cent to £12.5 billion from £11.7 billion in H1 FY2018. The reported revenue was up by 8.8 per cent from £11.3 billion in H1 FY2018 to £12.3 billion in H1 FY2019. The increase in revenue was driven by a solid performance from the companyâs North America business. The companyâs Europe business win UK Defence contract which boosted the company sales. The companyâs underlying operating profit surged by 5.8 per cent from £899 million in H1 FY2018 to £951 million in H1 FY2019. The companyâs reported operating profit increased by 6.9 per cent to £913 million in H1 FY2019 from £854 million in H1 FY2018. The company has maintained an operating margin at 7.5 per cent for the period. The companyâs adjusted earnings per share were 42.9 pence in H1 FY2019 versus 40.3 pence in H1 FY2018, reflecting an upside of 6.5 per cent. The companyâs reported earnings per share were 40.7 pence in H1 FY2019 versus 37.9 pence in H1 FY2018, reflecting an upside of 7.4 per cent. The interim dividend for H1 FY2019 stood at 13.1 pence as against 12.3 pence in H1 FY2018.
The company had demonstrated business strategy related execution in the first half of the fiscal year 2019. The group's top-line and net profit improved fairly due to the recent developments in its North America, Europe and Rest of the world regions.
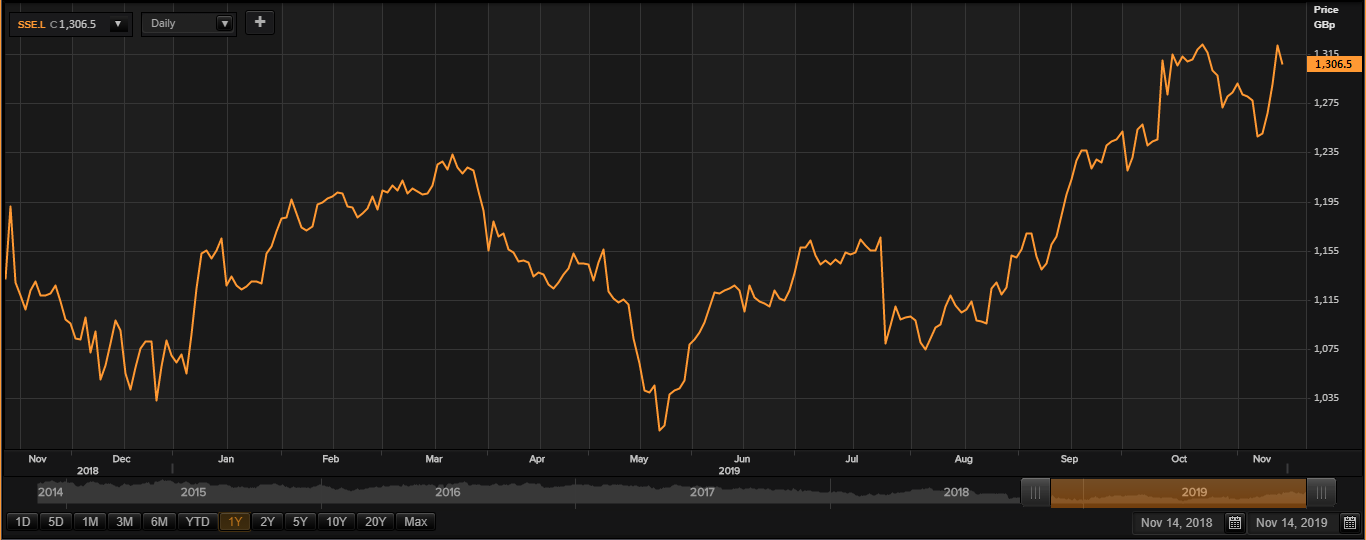
CPG-Share price performance

Daily Chart as at 15-November-19, after the market closed (Source: Thomson Reuters)
On 15th November 2019, Compass Group PLC shares closed at GBX 2,010 per share and was less than by 1.034 per cent in comparison to the last traded price of the previous day. The companyâs market capitalisation was at £31.84 billion at the time of writing.
Â
On 4th September 2019, the shares of CPG have touched a new peak of GBX 2,150.00 and reached the lowest price level of GBX 1,574.00 on 16th November 2018 in the last 52 weeks.
The stockâs traded volume was hovering around 1,828,779 at the time of writing after the market closed. The companyâs 5-day stock's daily average traded volume was 1,764,992.40; 30 days daily average traded volume - 2,451,167.60 and 90-days daily average traded volume â 2,579,049.60. The beta of the companyâs stock was recorded at 0.81 with a dividend yield of 1.92 per cent.
The shares of the company have delivered a negative return of 1.37 per cent in the last quarter. The companyâs stock surged by 21.81 per cent from start of the year to till date. The companyâs stock has given investors 25.11 per cent of positive return in the last year.Â
3i Group PLC
3i Group PLC (Identifier: III) is a London-headquartered global financial specialist and investment advisor which looks to make returns by putting its restrictive capital in an array of mid-market private equity investment vehicles, specifically in northern Europe and North America. Together with its global footprint and backed by solid capital, the company aim itself around chances where its domain and speculation mastery can generate value for the business, with two additional businesses, Private Equity and Infrastructure. Its zones of activity are classified into three fragments, which are private equity, infrastructure and debt management.
III-Financial Highlights (H1 2020, in £m)

(Source: LSE filings)
Due to the good levels of dividend income from Scandlines and 3iN and strong earnings growth of action, gross investment return was £798 million in the period (September 2018: £789 million), while on IFRS basis, it was £727 million. Operating expenses decreased to £60 million in the first six months of the year (September 2018: £62 million), while operating profit before carried interest rose to £749 million on investment basis and £706 million on IFRS basis from £744 million and £649 million respectively in the prior year. After the payment of 20 pence per share in respect of the second FY2019 dividend (September 2018: 22 pence per share), the diluted NAV per share at 30 September 2019 increased to 873 pence (31 March 2019: 815 pence), while the company generated a total return of £767 million, or a profit on opening shareholdersâ funds of 10%, (September 2018: £728 million, or 10%). Principally due to the £27 million of dividends received from Scandlines (September 2018: £22 million), cash income increased to £77 million (September 2018: £73 million), while it generated an operating cash loss of £2 million in the period (September 2018: £4 million profit). Due to the payment of the second FY2019 dividend of £194 million and net investment of £241 million in the period, net cash decreased to £50 million at 30 September 2019 (31 March 2019: £495 million). Driven by unrealised value growth of £498 million, cash investment and gains on foreign exchange translation, the investment portfolio value increased to £8,551 million at 30 September 2019 (31 March 2019: £7,553 million).
III-Share price performance
Daily Chart as at 15-November-19, after the market closed (Source: Thomson Reuters)
On 15th November 2019, 3i Group PLC shares closed at GBX 1,063 per share and was down by 0.978 per cent in comparison to the last traded price of the previous day. The companyâs market capitalisation was at £10.33 billion at the time of writing.Â
On 5th September 2019, the shares of III have touched a new peak of GBX 1,189.00 and reached the lowest price level of GBX 754.60 on 17th December 2018 in the last 52 weeks.
The stockâs traded volume was hovering around 2,114,076 at the time of writing after the market closed. The companyâs 5-day stock's daily average traded volume was 2,267,983.40; 30 days daily average traded volume- 1,692,267.40 and 90-days daily average traded volume â 1,541,221.46. The beta of the companyâs stock was recorded at 1.50 with a dividend yield of 3.53 per cent.
The shares of the company have delivered a negative return of 0.654 per cent in the last quarter. The companyâs stock surged by 37.44 per cent from start of the year to till date. The companyâs stock has given investors 34.59 per cent of positive return in the last year.Â
