


_07_03_2026_03_50_21_133108.jpg)

ImmuPharma Plc
ImmuPharma Plc (LON:IMM) is a London, United Kingdom headquartered, Pharmaceuticals and Biotech organisation, that majorly concentrates on the development of Therapeutic medicine, primarily drugs based on peptide therapeutics for the treatment of the likes of autoimmune diseases.
IMM Stock price Performance
On 6th December 2019, at 10:20 A.M GMT, By the time of reporting on this, ImmuPharma Plc âs stock price has been reported to be trading in the London Stock Exchange market at GBX 22.15 per stock on the London Stock Exchange (LSE) market, an incline of 5.48 per cent or GBX 1.15 per stock, as compared to the previous dayâs closing price, which was reported to be at GBX 21.00 per stock. While this piece was being written, the ImmuPharma Plc stock was reported to be trading 220.55 per cent above the 52-week low stock price, which was at GBX 6.91 per stock, that the companyâs stocks reached on November 27, 2019.
Reportedly, ImmuPharma Plcâs stock has given a positive change of 80.82 per cent in value in the last one year, from the price of GBX 12.25 per stock that the stocks set on December 06, 2018. The ImmuPharma Plc stock has given a positive change in the last six months in the value, of around 65.30 per cent from the stock price of GBX 13.40 per stock that the companyâs stock achieved on June 06, 2019. Reportedly, the Beta of the stock of the company, has been valued at 0.0624. This enables us to understand that the movement in the stock price of the company, is less volatile, in comparison with the movement of the comparative benchmark index.
DS Smith Plc
DS Smith Plc (LON:SMDS) is a London, United Kingdom located, general industrial company that is primarily engaged in the business of specialist packaging that is shaped into a series of parallel ridges and grooves so as to give added rigidity and strength. The companyâs major locations are located in the United Kingdom as well as some other parts of Europe.
SMDS Stock price Performance
On 6th December 2019, at 10:25 A.M GMT, By the time of reporting on this, DS Smith Plc âs stock price has been reported to be trading in the London Stock Exchange market at GBX 359.60 per stock on the London Stock Exchange (LSE) market, an incline of 2.22 per cent or GBX 7.80 per stock, as compared to the previous dayâs closing price, which was reported to be at GBX 351.80 per stock. While this piece was being written, the DS Smith Plc stock was reported to be trading 25.81 per cent above the 52-week low stock price, which was at GBX 285.83 per stock, that the companyâs stocks reached on December 20, 2018.
Reportedly, DS Smith Plcâs stock has given a positive change of 17.02 per cent in value in the last one year, from the price of GBX 307.30 per stock that the stocks set on December 06, 2018. The DS Smith Plc stock has given a positive change in the last six months in the value, of around 11.30 per cent from the stock price of GBX 323.10 per stock that the companyâs stock achieved on June 06, 2019. Reportedly, the Beta of the stock of the company, has been valued at 1.1453. This enables us to understand that the movement in the stock price of the company, is more volatile, in comparison with the movement of the comparative benchmark index.
BHP Group Plc
BHP Group Plc (LON:BHP), previously also known as BHP Billiton Plc, is a London, United Kingdom domiciled mining company, that majorly indulges in the business of extraction of commodities such as Iron Ore, Copper, Coal as well as Uranium.
BHP Stock price Performance
On 6th December 2019, at 10:30 A.M GMT, By the time of reporting on this, BHP Group Plc âs stock price has been reported to be trading in the London Stock Exchange market at GBX 1681.40 per stock on the London Stock Exchange (LSE) market, an incline of 1.19 per cent or GBX 19.80 per stock, as compared to the previous dayâs closing price, which was reported to be at GBX 1661.60 per stock. While this piece was being written, the BHP Group Plc stock was reported to be trading 18.47 per cent above the 52-week low stock price, which was at GBX 1419.26 per stock, that the companyâs stocks reached on December 06, 2018.
Reportedly, BHP Group Plcâs stock has given a positive change of 12.30 per cent in value in the last one year, from the price of GBX 1497.20 per stock that the stocks set on December 06, 2018. The BHP Group Plc stock has given a negative change in the last six months in the value, of around 6.82 per cent from the stock price of GBX 1804.40 per stock that the companyâs stock achieved on June 06, 2019. Reportedly, the Beta of the stock of the company, has been valued at 1.3905. This enables us to understand that the movement in the stock price of the company, is more volatile, in comparison with the movement of the comparative benchmark index.
Vodafone Group Plc
Vodafone Group Plc (LON:VOD) is a Newbury, United Kingdom headquartered Mobile Telecommunications organisation that provides services such as Mobile Telecommunications, Data across mobile, as well as fixed line services across the world and is one of the biggest companies in the world within its space.
 VOD Stock price Performance
On 6th December 2019, at 10:35 A.M GMT, By the time of reporting on this, Vodafone Group Plc âs stock price has been reported to be trading in the London Stock Exchange market at GBX 144.78 per stock on the London Stock Exchange (LSE) market, an incline of 0.36 per cent or GBX 0.52 per stock, as compared to the previous dayâs closing price, which was reported to be at GBX 144.26 per stock. While this piece was being written, the Vodafone Group Plc stock was reported to be trading 18.46 per cent above the 52-week low stock price, which was at GBX 122.22 per stock, that the companyâs stocks reached on May 20, 2019.
Reportedly, Vodafone Group Plcâs stock has given a negative change of 9.77 per cent in value in the last one year, from the price of GBX 160.46 per stock that the stocks set on December 06, 2018. The Vodafone Group Plc stock has given a positive change in the last six months in the value, of around 13.13 per cent from the stock price of GBX 127.98 per stock that the companyâs stock achieved on June 06, 2019. Reportedly, the Beta of the stock of the company, has been valued at 1.1764. This enables us to understand that the movement in the stock price of the company, is more volatile, in comparison with the movement of the comparative benchmark index.
WM Morrison Supermarkets Plc
WM Morrison Supermarkets Plc (LON:MRW) is a consumer services company based out of Bradford, United Kingdom. The companyâs major operations include retail supermarkets stores where they sell all kinds of foods and groceries as well as other things. The companyâs stores span across the length and breadth of United Kingdom.
MRW Stock price Performance
On 6th December 2019, at 10:40 A.M GMT, By the time of reporting on this, WM Morrison Supermarkets Plc âs stock price has been reported to be trading in the London Stock Exchange market at GBX 198.95 per stock on the London Stock Exchange (LSE) market, an incline of 0.99 per cent or GBX 1.95 per stock, as compared to the previous dayâs closing price, which was reported to be at GBX 197.00 per stock. While this piece was being written, the WM Morrison Supermarkets Plc stock was reported to be trading 13.59 per cent above the 52-week low stock price, which was at GBX 175.15 per stock, that the companyâs stocks reached on August 15, 2019.
Reportedly, WM Morrison Supermarkets Plcâs stock has given a negative change of 13.20 per cent in value in the last one year, from the price of GBX 229.20 per stock that the stocks set on December 06, 2018. The WM Morrison Supermarkets Plc stock has given a positive change in the last six months in the value, of around 1.53 per cent from the stock price of GBX 195.95 per stock that the companyâs stock achieved on June 06, 2019. Reportedly, the Beta of the stock of the company, has been valued at 0.6921. This enables us to understand that the movement in the stock price of the company, is less volatile, in comparison with the movement of the comparative benchmark index.
Comparative Share Price Chart of IMM, SMDS, BHP, VOD and MRW
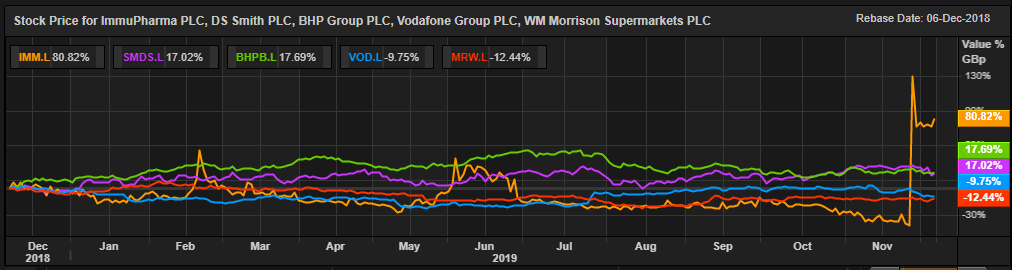
(Source: Thomson Reuters) Daily Chart as on 06-December-19, prior to the close of the market
