


Billington Holdings PLC (LON:BILN)
The United-Kingdom based holding company, Billington Holdings Plc, through its subsidiaries, operates as a designer, manufacturer and installer of structural steelwork.
BILN-Trading update for FY19 period ended 31st December 2019
The management of the company expects the revenue to be higher in the financial year ending 31 December 2019, in contrast to the current market expectation of £78 million reflecting the successful delivery of several large projects during the year.
The profit of the company is also expected to be above the market forecast of £5.2 million, and the business is expected to be healthy in cash generation.
The current economic and political uncertainties might throw challenges for the company in 2020. However, with positive momentum and the strong position in the market and consistent financial health of the company is well-positioned to proceed into 2020 with confidence.
BILN-Stock price performance
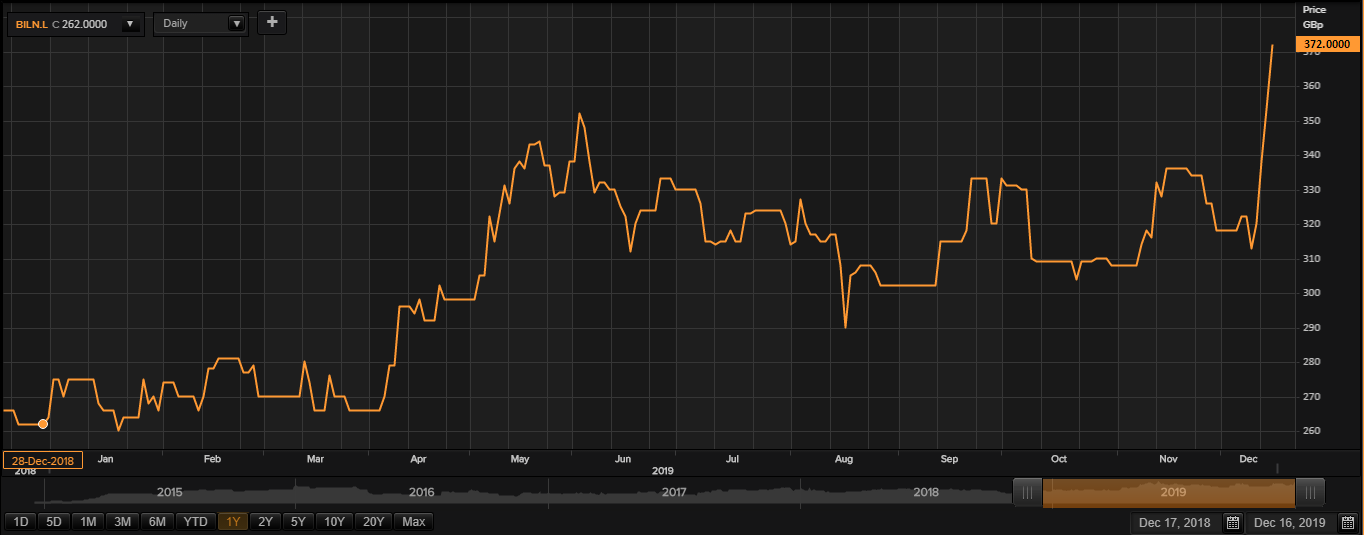
(Source: Thomson Reuters) Daily Chart as on Dec-16-19, before the LSE market close
At the time of writing at 12:01 PM Greenwich Mean Time, on 16th December 2019, the shares of Billington Holdings PLC were trading at a current market price of GBX 372.00 per share, which were up by 5.38 per cent from the last closing price on the previous day. While writing, the groupâs market capitalisation was approximately £45.40 million.
The shares of Billington Holdings PLC traded at a high-price mark of GBX 372.00 on 16th December 2019 and at a low-price mark of GBX 257.00 on 20th December 2018 in the last twelve-month period. The companyâs shares were trading at 44.75 per cent higher than the last twelve-month low-price mark as can be seen in the price chart at the current trading level.
While writing, the stockâs traded volume stood at 58,923. The stockâs 5-day daily average traded volume of the company was 16,701.00; 30 days daily average traded volume- 35,362.17 - and 90-days daily average traded volume â 16,046.74. The beta of the companyâs stock was recorded at 0.43, which indicates lesser volatility with reference to the benchmark index along with a dividend yield of 3.68 per cent.
The companyâs shares have generated a positive return of 12.06 per cent in the last quarter. From the start of the year to till date, the companyâs stock was up by 33.71 per cent. Since last month, the companyâs stock has given investors a positive return of 6.33 per cent. Â
DFS Furniture PLC (LON:DFS)
The United Kingdom domiciled furniture and fixture retailing company, DFS Furniture Plc designs, manufactures and retails chairs, sofas and other furnishings.
The company provides Recliners and Sofa beds along with purposely designed items like dining tables and chairs, cabinets and Television stands.
The company also markets bed mattresses, wardrobes, mirrors and rugs. Â Apart from the United Kingdom, the company has a presence across Europe, Asia and the Pacific Islands, North America, Middle East and Oceania.
DFS-Recent News
Alison Hutchinson was recently appointed as a Senior Independent Director of the company.
DFS-Business performance for FY19, 48-week period ended 30th June 2019
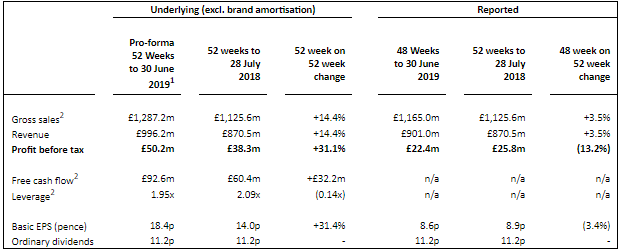
(Source: Companyâs filings, London Stock Exchange)
Since the accounting period reference date was changed to 30th June from 31st July, therefore, FY19 has 48-week accounting period. The reported revenue of the company was recorded at £901 million in FY19. The companyâs profit before taxation (reported) stood at £22.4 million in FY19. The company has proposed a final dividend of 7.5 pence per share during the period.
DFS-Stock price performance
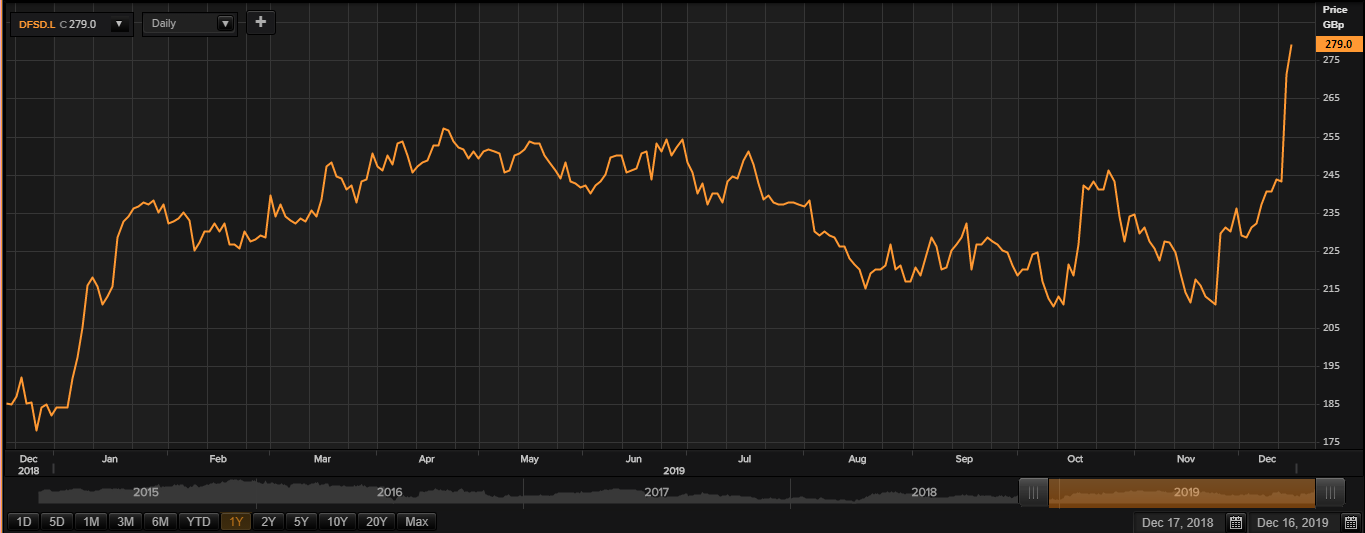
(Source: Thomson Reuters) Daily Chart as on Dec-16-19, before the LSE market close
At the time of writing at 12:16 PM Greenwich Mean Time, on 16th December 2019, the shares of DFS Furniture Plc were trading at a current market price of GBX 279.00 per share, which were up by 2.95 per cent from the last closing price on the previous day. While writing, the groupâs market capitalisation was approximately £575.77 million.
The shares of DFS Furniture Plc traded at a high-price mark of GBX 280.50 on 16th December 2019 and at a low-price mark of GBX 177.80 on 24th December 2018 in the last twelve-month period. The companyâs shares were trading at 56.92 per cent higher than the last twelve-month low-price mark and at 0.53 per cent lower from the last twelve-month high-price mark as can be seen in the price chart at the current trading level.
While writing, the stockâs traded volume stood at 114,332. The stockâs 5-day daily average traded volume of the company was 2,568,599.00; 30 days daily average traded volume- 667,656.10 - and 90-days daily average traded volume â 273,377.71. The beta of the companyâs stock was recorded at 1.35, which indicates higher volatility with reference to the benchmark index along with a dividend yield of 4.13 per cent.
The companyâs shares have generated a positive return of 19.65 per cent in the last quarter. From the start of the year to date, the companyâs stock was up by 49.06 per cent. Since last month, the companyâs stock has given investors a positive return of 20.71 per cent.Â
Â
Indivior PLC (LON:INDV)
North Chesterfield, USA-headquartered, Indivior PLC is a speciality pharmaceutical company which focuses on opioid addiction treatment drugs and has 20 plus years of experience. The companyâs year of inception is 2014 after Reckitt Benckiser separated its speciality pharmaceuticals segment into a separate entity, which focused on developing, manufacturing, and selling prescription drugs used for the treatment of opioid dependence. Primary products of the company include Subutex and its Naloxone-combined preparation Suboxone, and the company has strong presence in the United States and other nations.
INDV-Recent News
Indivior revealed a collaborative programme with Virginia Tech to study long-term healing in people with Opioid use syndrome. This study shall set an example as how the industry and academia can work together to address a major healthcare issue.
INDV-Trading Update for Q3 FY19
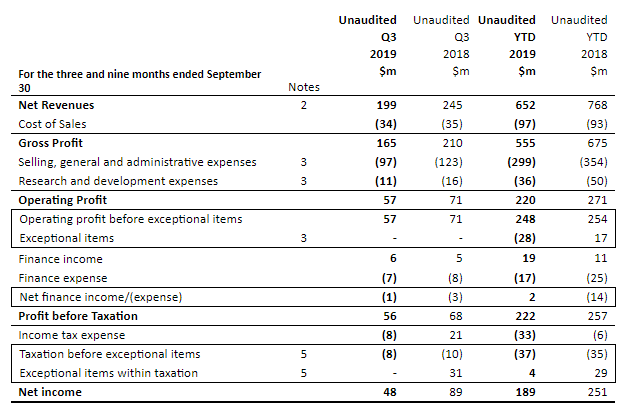
(Source: Companyâs filings, London Stock Exchange)
In the third quarter of 2019, the companyâs total net revenue plunged by 19 per cent at actual exchange rates (down by 18 per cent at constant exchange rates) to $199 million (Q3 FY18: $245 million) and total net revenue YTD 2019 plunged by 15 per cent to $652 million (YTD 2018: $768 million) at actual exchange rates ( down by 14 per cent at constant exchange rates).
Year till Date 2019 gross margin was 85 per cent in contrast to 88 per cent in Year till Date 2018, and 83 per cent in the third quarter of 2019 versus 86 per cent in the third quarter of 2018.
Reflecting lower net revenue, Q3 2019 operating profit as reported and on an adjusted basis was $57 million, 20 per cent lower in comparison to the previous year, while on an adjusted basis, YTD 2019 operating profit was $248 million versus $254 million (33 per cent margin) YTD 2018, and YTD 2019 operating profit as reported was $220 million, 19 per cent lower compared to the prior year. The net income stood at $48 million in the third quarter of 2019. The net income was recorded at $189 million in YTD 2019.
INDV-Stock price performance
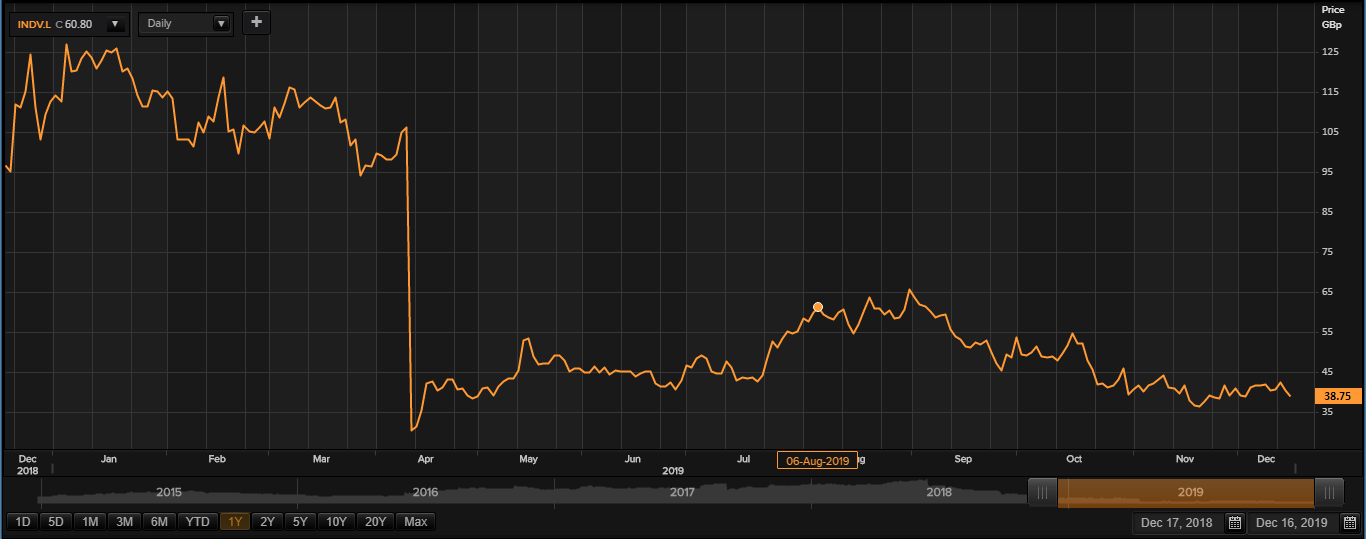
(Source: Thomson Reuters) Daily Chart as on Dec-16-19, before the LSE market close
At the time of writing at 12:27 PM Greenwich Mean Time, on 16th December 2019, the shares of Indivior PLC were trading at a current market price of GBX 38.75 per share, which were down by 3.37 per cent from the last closing price on the previous day. While writing, the groupâs market capitalisation was approximately £289.45 million.
The shares of Indivior PLC traded at a high-price mark of GBX 131.04 on 07th January 2019 and at a low-price mark of GBX 20.98 on 10th April 2019 in the last twelve-month period. The companyâs shares were trading at 84.70 per cent higher than the last twelve-month low-price mark and at 70.43 per cent lower from the last twelve-month high-price mark as can be seen in the price chart at the current trading level.
While writing, the stockâs traded volume stood at 797,034. The stockâs 5-day daily average traded volume of the company was 1,943,345.40; 30 days daily average traded volume- 2,276,938.17- and 90-days daily average traded volume â 2,695,775.26. The beta of the companyâs stock was recorded at 0.81, which indicates lesser volatility with reference to the benchmark index.
The companyâs shares have generated a negative return of 25.33 per cent in the last quarter. From the start of the year to till date, the companyâs stock was down by 64.31 per cent. Since last month, the companyâs stock has given investors a negative return of 1.60 per cent.Â
