


Enteq Upstream Plc
Enteq Upstream Plc (NTQ) is an AIM-listed non-renewable energy resource company, engaged in the supplying of specialised high-end technologies and products to the global oil & gas companies. The drilling tools division of the company specialises in measuring instruments and directional drilling parts for using in resource exploration. The companyâs shares were admitted to the main market of the London Stock Exchange for trading on 18th May 2012. The major institutional investors in the company are Hargreave Hale Ltd., Allianz Global Investors GmbH (UK) and Octopus Investments Ltd.
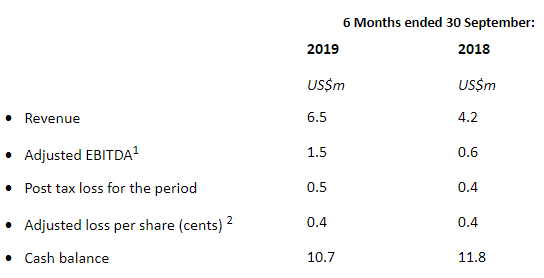
NTQ-Financial highlights for H1 FY20
(Source: LSE)
On 14th November 2019, the company released its interim results for the six months period ended 30th September 2019 of the fiscal year 2020. The companyâs revenue increased to US$6.5 million in H1 FY20 from US$4.2 million in H1 FY19. The companyâs adjusted EBITDA increased to US$1.5 million in H1 FY20 from US$0.6 million in H1 FY19. The companyâs post taxation loss increased to US$0.5 million in H1 FY20 from US$0.4 million in H1 FY19. The companyâs loss per share stood at 0.4 cents in H1 FY20. The company had cash balances of US$10.7million in H1 FY20 as compared to US$11.8 million in H1 FY19.
NTQ-Share price performance
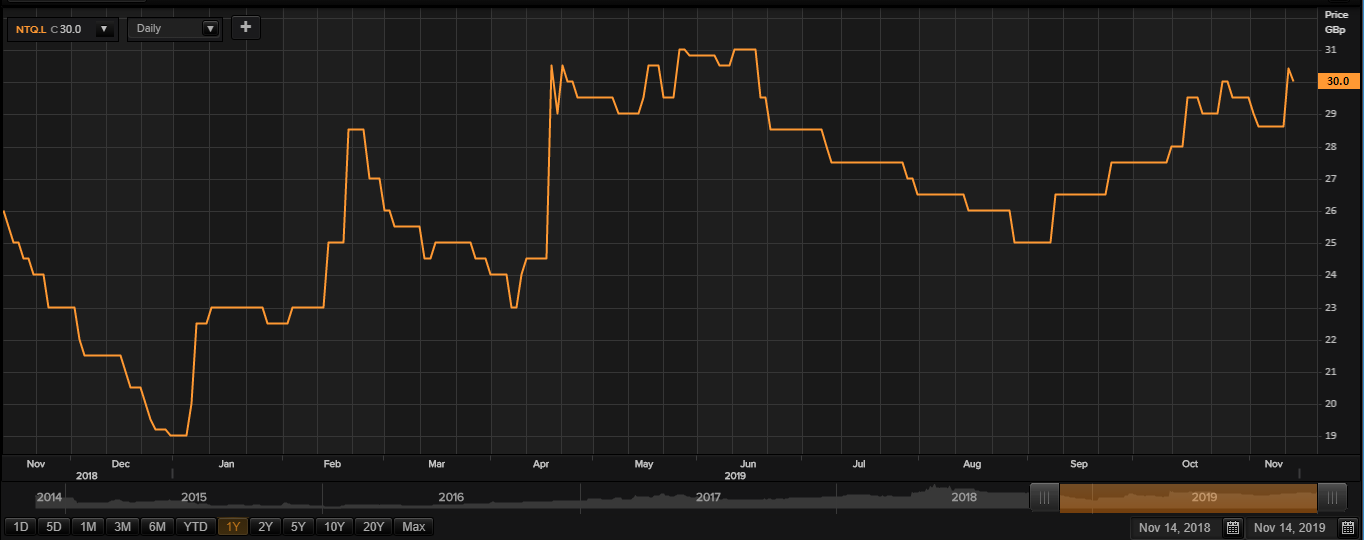
Daily Chart as at 14-November-19, before the market closed (Source: Thomson Reuters)
On 14th November 2019, while writing at 08:35 AM GMT, Enteq Upstream Plc shares were clocking a current market price of GBX 30.00 per share; which was less by 1.31 per cent in comparison to the last traded price of the previous day. The companyâs market capitalisation was at £19.90 million at the time of writing.
On 13th November 2019, the shares of NTQ have touched a new peak of GBX 33.00 and reached the lowest price level of GBX 18.00 on 02nd January 2019 in the last 52 weeks. The companyâs shares were trading at 9.09 per cent lower from the 52-week high price mark and 66.66 per cent higher than the 52-week low price mark at the current trading level as can be seen in the price chart.
The stockâs traded volume was hovering around 39,814 at the time of writing before the market close. The companyâs 5-day stock's daily average traded volume was 123,458.60; 30 days daily average traded volume- 56,042.83 - and 90-days daily average traded volume â 39,225.00. The volatility of the companyâs stock was 2 per cent lower as compared with the index taken as the benchmark, as the beta of the companyâs stock was recorded at 0.98.
The shares of the company have delivered a positive return of 14.72 per cent in the last quarter. The companyâs stock surged by 58.33 per cent from the start of the year to till date. The companyâs stock has given investors 16.92 per cent of a positive return in the last year.Â
Â
Lekoil Ltd
Nigerian oil and gas exploration and production company, Lekoil Ltd (LEK) has major interests in Nigerian and Namibian prospects. In addition, the company also has exploration interests in the United States and the Cayman Islands. Lekoil Nigeria Limited, Lekoil Exploration and Production Pty, Lekoil Management Corporation, Lekoil Limited SARL and Lekoil 310 limited are various subsidiaries of the company. The shares of the company trade under the ticker name LEK, and are listed on the AIM segment of the London Stock Exchange.
LEK-Financial highlights for H1 FY19
(Source: LSE)
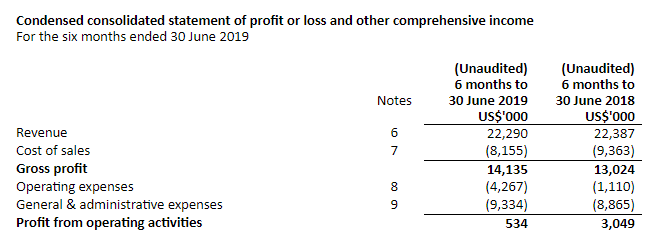
The companyâs operating profit stood at US$0.5 million in H1 FY19 as against US$3.0 million in H1 FY18. The company incurred a net loss of US$5.2 million in H1 FY19 as against a net profit of US$1.8 million. The company had cash balances of US$8.3 million at 31st August 2019.
Â
LEK-Share price performance
Daily Chart as at 14-November-19, before the market closed (Source: Thomson Reuters)
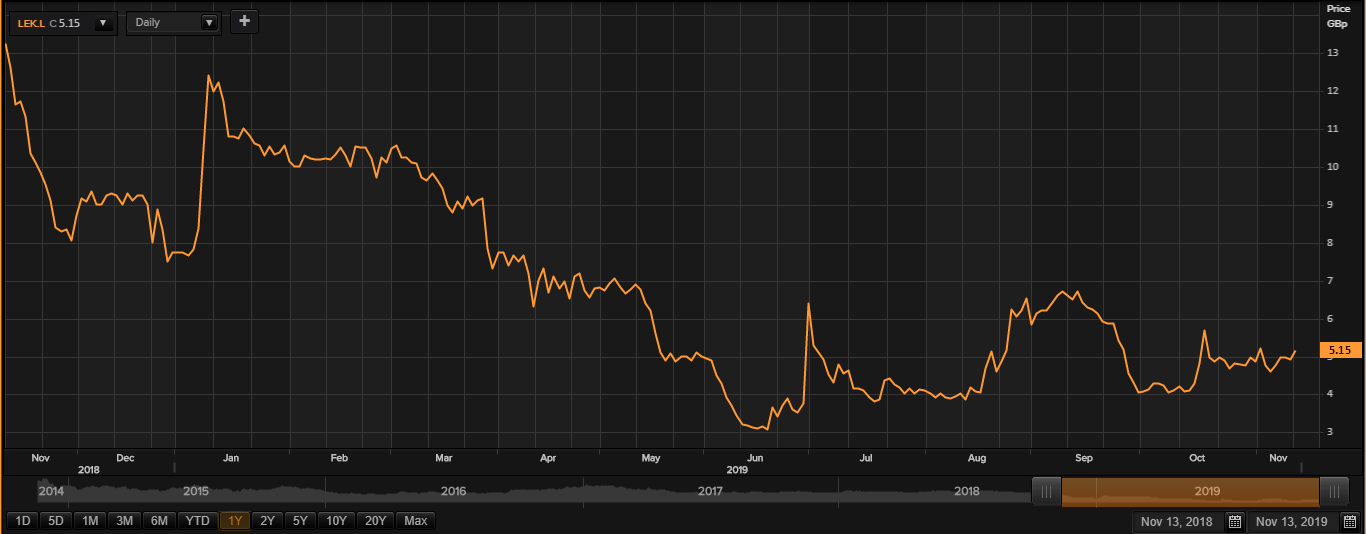
On 14th November 2019, while writing at 08:41 AM GMT, Lekoil Ltd shares were clocking a current market price of GBX 5.15 per share; which remained flat in comparison to the last traded price of the previous day. The companyâs market capitalisation was at £27.62 million at the time of writing.
On 14th January 2019, the shares of LEK have touched a new peak of GBX 13.00 and reached the lowest price level of GBX 2.76 on 19th June 2019 in the last 52 weeks. The companyâs shares were trading at 60.38 per cent lower from the 52-week high price mark and 86.59 per cent higher than the 52-week low price mark at the current trading level as can be seen in the price chart.
The companyâs 5-day stock's daily average traded volume was 698,774.80; 30 days daily average traded volume- 1,468,209.83 - and 90-days daily average traded volume â 2,864,528.59. The volatility of the companyâs stock was 57 per cent lower as compared with the index taken as the benchmark, as the beta of the companyâs stock was recorded at 0.43.
The shares of the company have delivered a positive return of 22.91 per cent in the last quarter. The companyâs stock plunged by 33.46 per cent from the start of the year to till date. The companyâs stock has given investors 59.21 per cent of a negative return in the last year.Â
Â
Iofina Plc
Iofina Plc (IOF) is a London, the United Kingdom-based holding company. The company is engaged in the production and exploration of iodine, formed water and natural gas, and iodine speciality chemical derivatives. The company operates in the United Kingdom and in the United States. The companyâs business is differentiated in two segments: Iodine and Iodine Derivatives, and Montana.
IOF-Recent News
The company has ventured into a feminised hemp seed making and genetics company, Organic Vines OP LLC through an investment. Organic Vines aims to produce high quality, feminised, organic certified hemp seeds per cycle, has 4 greenhouses with a capacity of 50 million plus hemp seeds per growth cycle. IofinaEX, the Iofina subsidiary made an investment of US$900,000 in Organic Vines.
IOF-Trading update for Q3 FY19
Since Iodine prices have continued to move upwards, with global supplies remaining tight and demand growing, the company produced 167.3 metric tonnes of crystalline iodine during the period.
Furthermore, IofinaEX, the chemical division of the company continues to see growth in hemp-related products such as Cannabidiol and looks forward to targeting the US markets and abroad to push the company to newer heights in 2020 and beyond.
IOF-Financial highlights for H1 FY19
(Source: LSE)
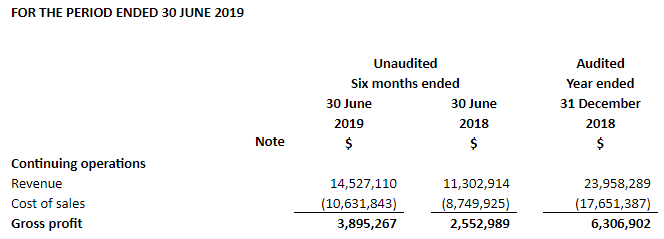
The companyâs revenue surged by 29 per cent to $14.53 million in H1 FY19 as against $11.30 million in H1 FY18. The companyâs gross profit surged by 53 per cent to $3.90 million in H1 FY19 as against $2.55 million in H1 FY18. The companyâs EBITDA surged by 172 per cent to $1.97 million in H1 FY19 as against $0.72 million in H1 FY18. The companyâs operating profit stood at $1.21 million in H1 FY19 as against a loss of $0.05 million in H1 FY18. The companyâs basic loss per share stood at $0.002 in H1 FY19 as against $0.006 in H1 FY18. The companyâs cash balances were recorded at $10.26 million in H1 FY19 as against $3 million in H1 FY18.
IOF-Share price performance
Daily Chart as at 14-November-19, before the market closed (Source: Thomson Reuters)
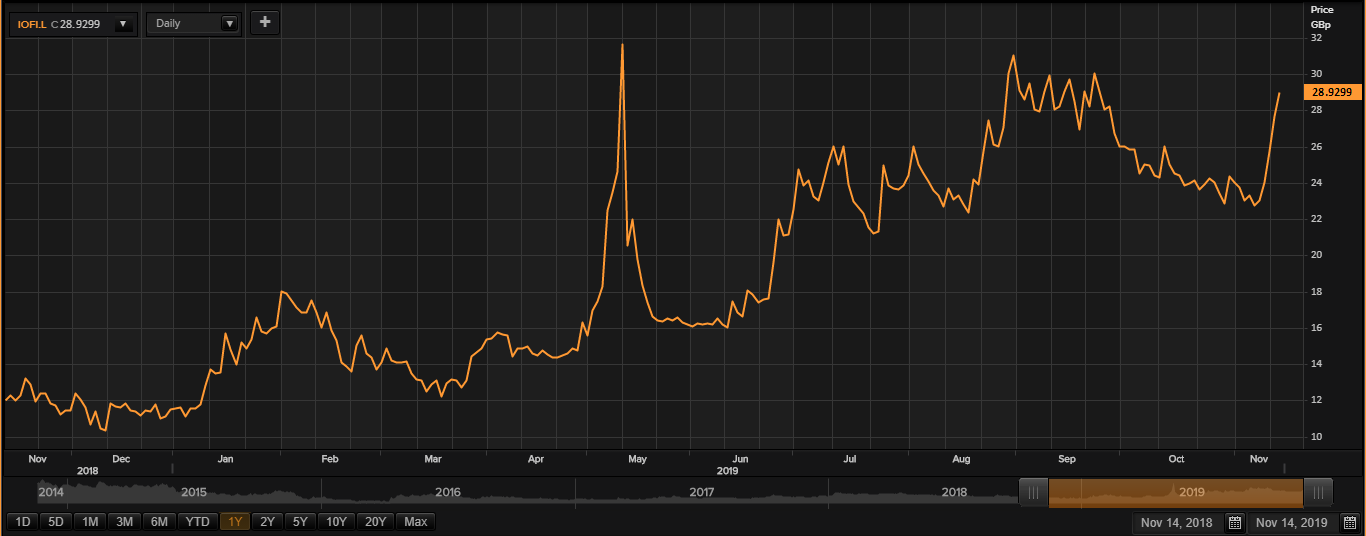
On 14th November 2019, while writing at 08:45 AM GMT, Iofina Plc shares were clocking a current market price of GBX 28.92 per share; which was more by 4.59 per cent in comparison to the last traded price of the previous day. The companyâs market capitalisation was at £53.03 million at the time of writing.
On 13th May 2019, the shares of IOF have touched a new peak of GBX 33.28 and reached the lowest price level of GBX 9.88 on 11th December 2018 in the last 52 weeks. The companyâs shares were trading at 13.10 per cent lower from the 52-week high price mark and 192.71 per cent higher than the 52-week low price mark at the current trading level as can be seen in the price chart.
The stockâs traded volume was hovering around 185,009 at the time of writing before the market close. The companyâs 5-day stock's daily average traded volume was 1,462,999.80; 30 days daily average traded volume- 861,650.03 - and 90-days daily average traded volume â 963,632.06. The volatility of the companyâs stock was 66 per cent higher as compared with the index taken as the benchmark, as the beta of the companyâs stock was recorded at 1.66.
The shares of the company have delivered a positive return of 16.91 per cent in the last quarter. The companyâs stock surged by 148.86 per cent from the start of the year to till date. The companyâs stock has given investors 131.37 per cent of a positive return in the last year.Â
