


Avast PLC
Avast Plc (AVST) is a Prague, the Czech Republic-based company that offers security software. The company's operations are now differentiated in two operating segments: consumer products and products for the small and medium business (SMB). The company also offers individual computer antivirus security software under the AVG and Avast brands.
Recent News
On 18th October 2019, the company will announce the Q3 FY19 trading update.
Financial Highlights (H1 FY2019, US$ million)The companyâs overall performance was in line with expectations. The companyâs adjusted Billings, excluding FX, disposal of the managed workplace business, and discontinued business, surged by 12.5 per cent and 9.2 per cent in actual rates to $454.6 million as compared with the corresponding period of the last year. The statutory revenue rose by 9.5 per cent to $425.4 million against the $388.6 million in H1 FY18. Adjusted EBITDA surged by 6.5 per cent to $236.5 million against the same period in 2018, while adjusted EBITDA margin increased to 55.4 per cent. Adjusted net income climbed by 13.8 per cent to $148.2 million as compared to $130.2 million in H1 FY18. Adjusted fully diluted earnings per share slightly increased to $0.15 against the $0.14 in H1 FY18. Continued robust cash generation with Unlevered Free Cash Flow increased to $230.4 million, and Levered Free Cash Flow surged to $200.2 million. On a statutory basis, net income stood at $112.6 million, a decrease of 29.7 per cent from the previous year same period data. On 30th June 2019, net debt reduced to 15.4 per cent to $1,104.6 million as compared with the corresponding period of the last year. Net debt / LTM Adjusted EBITDA was 2.4x at the end of the half-year of the financial year 2019.Â
The companyâs first-half performance underpins the robust full-year 2019 outlook. The company expect like-for-like (LFL) for the financial year 2019 revenue growth to be at the upper end of the earlier stated high single-digit percentage data. In FY2019, the company expect mid-single-digit percentage decline in the consumer direct mobile revenue.
In FY2019, adjusted EBITDA margin will be flat. The companyâs performance will continue to perform well with strength in leading indicators such as deferred revenue and billings. The privacy products that complement the companyâs best-in-class antivirus security has formed a decent renewal base, underpinning opportunities for the financial year 2019.
Although the companyâs revenue and bottom-line numbers rose in H1 FY19, the profitability margins have remained stagnant or decreased. Â
AVST Share price performance
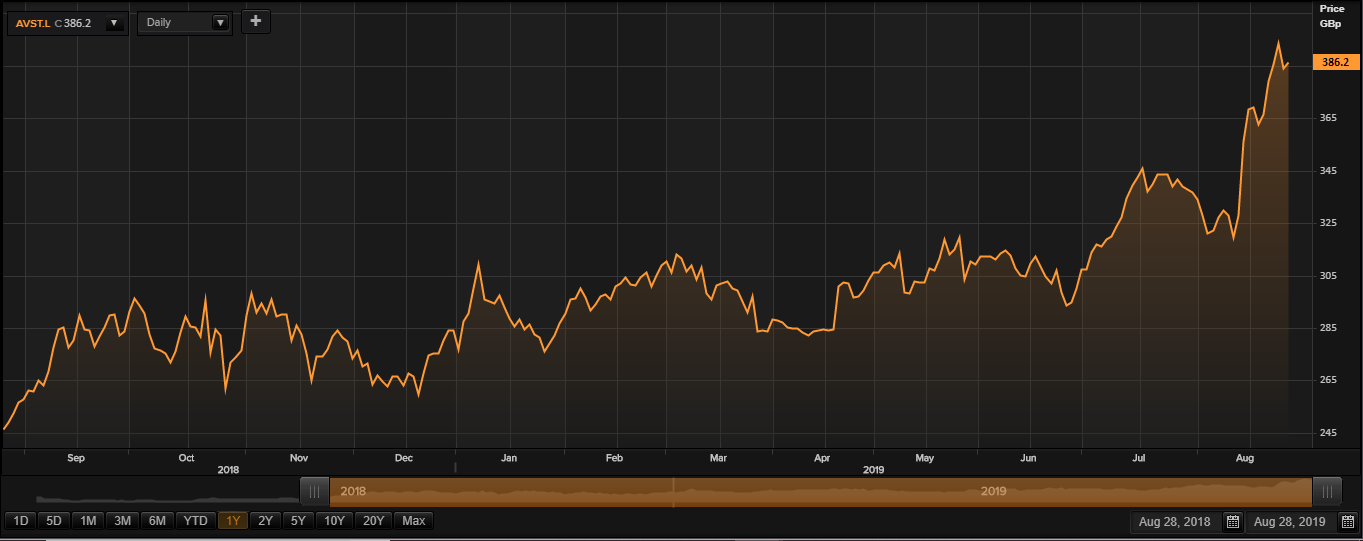
Daily Chart as on 28-August-19, before the market close (Source: Thomson Reuters)
AVST shares while writing on 28 August 2019, at 02:39 PM GMT, were trading at GBX 386.2 per share; which was up by 0.57 per cent as against the previous day closing price level. At the time of writing, the companyâs M-cap (market capitalisation) was recorded at ~ £3.73 billion.
In the last year, AVST shares have touched a high of GBX 399.40 (as on 23 August 2019) and a low-price level of GBX 247.60 (as on 20 December 2018). At the current trading level, its shares were trading at 3.30 per cent lower than the 52-week high price level and 55.97 per cent higher than the 52-week low price level.
The stockâs traded volume while writing before the market close, was hovering ~ 745,242. Stock's average traded volume for 5 days was 2,493,268.60; 30 days- 1,534,622.47 and 90 days â 1,617,474.14. The 180 days beta of the companyâ s stock was 0.46, which means it was comparatively less volatile with the benchmark index.
At the time of writing, the shares of the company were moving above the 30-days and 200-SMA, which depicts an uptrend from the current trading levels.
In the past 3 months, AVST shares have delivered a positive return of 22.06 per cent. Since the beginning of the year to till date, the stock prices surged by 35.21 per cent. In the last year, the companyâs stock delivered a positive return of 56.16 per cent.Â
The RSI (Relative Strength Index) of the stock was recorded at 65.82, 68.62 and 68.80 for the period of 30-days, 14-days and 9-days respectively. The stockâs RSI was recorded at 49.57 Â for 3-day.Â
Smithson Investment Trust Plc
Smithson Investment Trust plc (SSON) is a United Kingdom-based asset management company. The company provides shareholders with capital appreciation by investing in value stocks ranging across various sectors such as financial services, healthcare, information technology and many more, which belong to listed or traded companies. The diversification of the portfolio in the underlying strategy of the company.
Financial highlights for H1 FY19 (£,000)
The companyâs revenue was recorded at £6,446 thousand in H1 FY19. The companyâs gain on investments held was recorded at £231,176 thousand in H1 FY19. The companyâs profit before tax was recorded at £232,111 thousand in H1 FY19. The companyâs profit for the period was recorded at £231,392 thousand in H1 FY19. The company had a cash balance of £52,512 thousand as at 30th June 2019. The companyâs NAV per share was recorded at 1,202.5 pence as at 30th June 2019.
SSON Share price performance
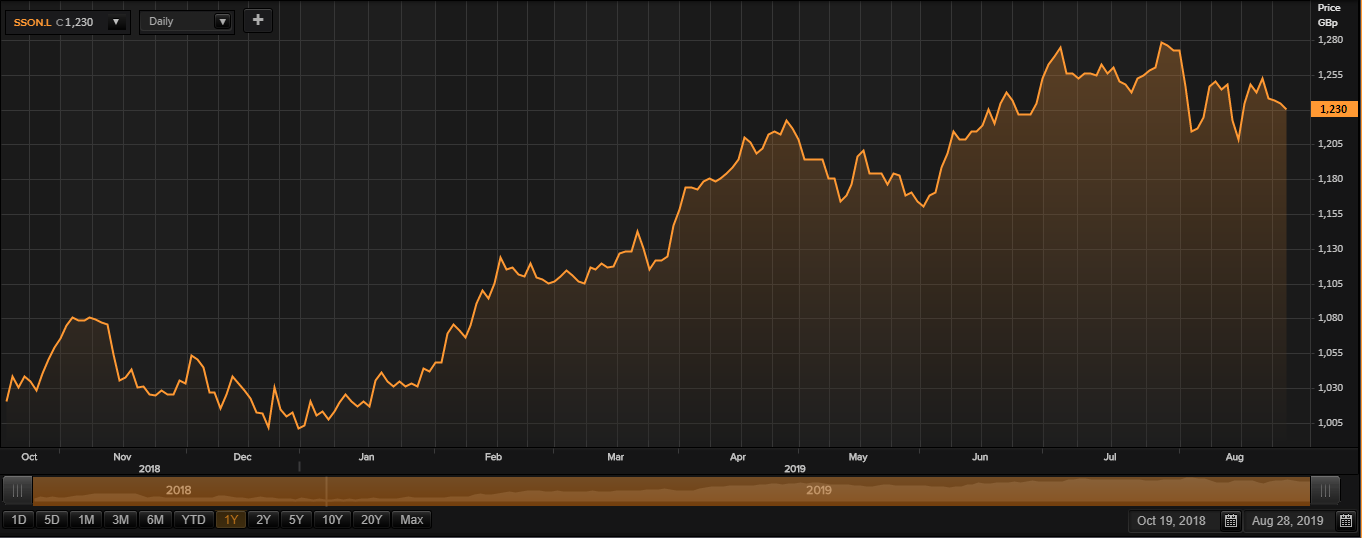
Daily Chart as on 28-August-19, before the market close (Source: Thomson Reuters)
As on 28 August 2019, while writing at 02:46 PM GMT, SSON shares were trading at GBX 1,230 per share; lower by 0.32 per cent as against the previous day closing price level. At the time of writing, the companyâs M-cap (market capitalisation) was recorded at ~ £1.32 billion.
In the last year, SSON shares have touched a new high of GBX 1,286.36 (as on 30 July 2019) and a low-price level of GBX 984.80 (as on 02 January 2019). At the current trading level, as quoted in the price chart, its shares were trading at 4.38 per cent lower than the 52-week high price mark and 24.89 per cent higher than the 52-week low price mark.
The stockâs traded volume, while writing before the market close, was hovering ~ 188,035. Stock's average traded volume for 5 days was 207,836.40; 30 days- 280,514.20 and 90 days â 332,126.23. The 180 days beta of the companyâ s stock was 0.74, which means it was less volatile as compared to the index considered as the benchmark.
At the time of writing, the shares of the company were moving below the 30-days and 60-days SMA (simple moving average), depicting a downtrend from the current levels.
In the past 3 months, the companyâs shares delivered an optimistic return of 4.22 per cent. Since the beginning of the year to till date, the companyâs stock value increased by 23.38 per cent.
The stockâs Relative Strength Index was recorded at 50.22, 47.20 and 46.12 for the 30-days, 14-days and 9-days respectively. Also, the stockâs RSI was recorded at 35.11 Â for 3-day.
Â
Hasbro Inc
Hasbro Inc (0J3K) is a manufacturer of board games and toys based out of the United States. The company owns some popular characters which are a part of our childhood such as G.I Joe and Transformers.
Financial Highlights-Q1 FY19
The company reported a revenue of $ 984.53 million for Q1 FY19. The companyâs operating profit for Q1 FY19 was recorded at $128.33 million. The companyâs earnings before income taxes for Q1 FY19 were recorded at $6.10 million. The net-earnings of the company for Q1 FY19 were recorded at $13.43 million.
Hasbro Inc Share price performance
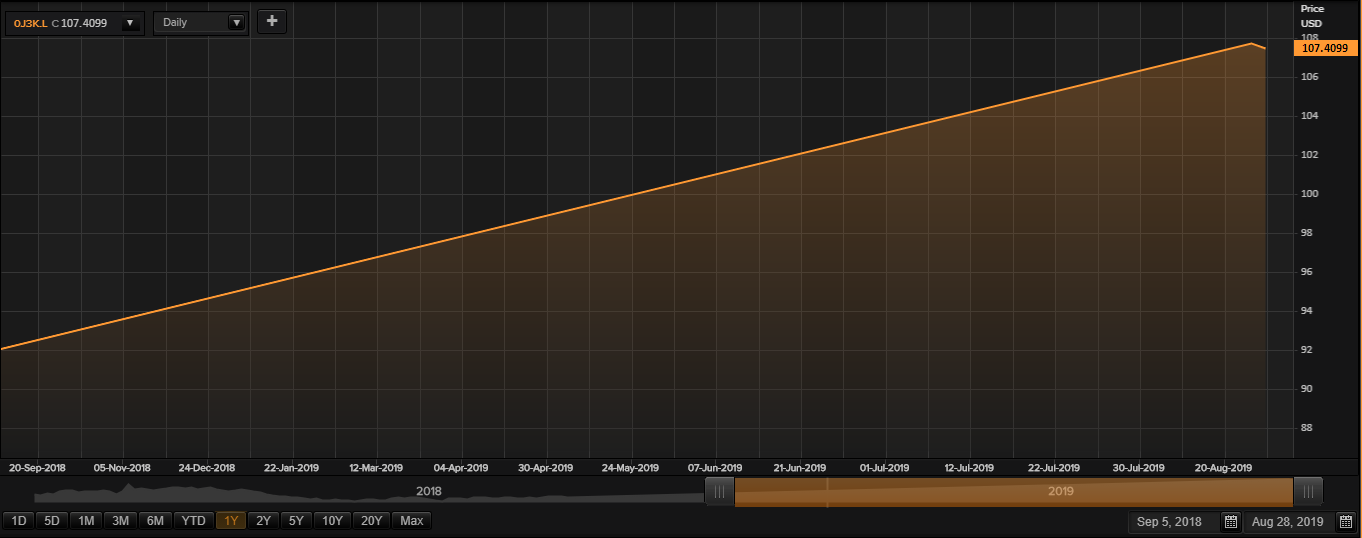
Daily Chart as on 28-August-19, before the market close (Source: Thomson Reuters)
While writing (as on 28 August 2019, at 02:57 PM GMT), Hasbro shares were trading at USD 107.40 per share. At the time of writing, the companyâs M-cap (market capitalisation) was recorded at ~ $13.54 billion.
In the last year, Hasbro shares have touched a new peak of USD 126.20 (as on 30 July 2019) and a bottom price level of USD 78.11 (as on 24 December 2018). Its shares, at the current trading levels, were trading at 14.89 per cent lower than the highest level reached in last 52-week and 37.49 per cent higher than the 52-week lower price mark.
The stockâs traded volume, while writing before the market close, was hovering ~ 1,679. The average traded volume for 5 days was 3,395.40. The stock beta of the company as on date was 1.08, which means it was more volatile in as compared with the index considered as the benchmark.
At the time of writing, the shares of the company were moving below the 30-days SMA (simple moving average), depicting a downtrend from the current trading levels.
From beginning of the year to till date, the companyâs stock plunged by 6.04 per cent. The stockâs RSI (Relative Strength Index) was recorded at 45.73, 43.46 and 49.42 for the 30-days, 14-days and 9-days respectively, while, the stockâs RSI was recorded at 78.91 (3-day).
