


The travel and leisure sector have significant weights in the composition of most of the indexes. The performance of these companies depends on consumer spending pattern, which is variable in nature. This sector flourishes with the rise of disposable incomes and confidence level of consumers. Travel and leisure sector stocks include pubs and restaurants, bookmakers, hotels, bus operators, airlines, boutique, gaming companies, caterers and fast-food delivery services, cinema chains as well as travel companies. Below is a comparative chart, depicting stock prices of some stocks related to this sector.
Comparative Stock price chart of TUI, GYS, NEX, MAB and SSTYÂ
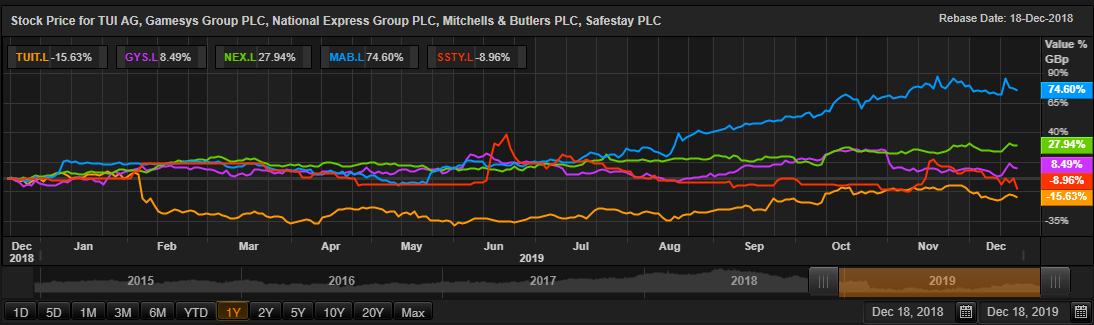
(Source: Thomson Reuters)
TUI AG (LON:TUI)
TUI AG is a Germany-based integrated tourism group with a broad portfolio under the Group umbrella, ranging from tour operators and travel agencies to airlines, hotels and cruise liners. It is the leading European tour operator with operations spread across 180 destinations and specialising in sales and marketing, as well as holiday experiences.
TUI-Financial highlights for FY19
The turnover of the group was reported at a year on year growth of 2.5 per cent from â¬18,469 million in FY 2018 to â¬18,928 million in FY 2019. The earnings before tax were reported to have plunged by around 28.4 per cent year on year from â¬966 million in FY 2018 to â¬691 million in FY 2019. This also led the management of the company to declare a reduced dividend for the year, with the proposed dividend of â¬0.54 per share.Â
TUI-Share price performance
On 18th December 2019, at the time of writing (before market close, GMT 1:18 PM), shares of TUI AG were trading at GBX 968, down by 1.41 per cent against its previous day closing price. Stock's 52 weeks High and Low is GBX 1,230.00 /GBX 686.60. At the time of writing, the share was trading 21.30 % lower than its 52w High and 40.98% higher than its 52w low. Stockâs average traded volume for 5 days was 2,018,440.20; 30 days - 1,438,054.97 and 90 days - 1,585,341.24. The average traded volume for 5 days was up by 40.36% as compared to 30 days average traded volume. The companyâs stock beta was 0.88, reflecting slightly lower volatility as compared to the benchmark index. The outstanding market capitalisation was around £5.77 billion.
Gamesys Group PLC (LON:GYS)
Gamesys Group PLC is a Travel & Leisure company providing online gaming services. The company is a market leader in providing online bingo and casino games to its international consumer base. The company primarily operates in the region of UK, Nordics, Rest of Europe and ROW. The company was formally known as JPJ Group Plc.
GYS-Financial highlights for Q3 FY19
The Gaming revenue was up by 23 per cent year-on-year, as a result of high organic growth in the markets outside the United Kingdom. Due to the impact from higher UK gaming taxes introduced in the period, Adjusted EBITDA decreased by 8 per cent year-on-year. Due to the reduction in EBITDA, the Adjusted net income too decreased by 20 per cent.
GYS-Share price performance
On 18th December 2019, at the time of writing (before market close, GMT 1:24 PM), Gamesys Group PLC shares were trading at GBX 703.00, down by 0.99 per cent against its previous day closing price. Stock's 52 weeks High and Low is GBX 822.00 /GBX 600.00. At the time of writing, the share was trading 14.48% lower than its 52w High and 17.17% higher than its 52w low. Stockâs average traded volume for 5 days was 412,677.40; 30 days - 218,531.07 and 90 days - 180,714.87. The average traded volume for 5 days was up by 88.84% as compared to 30 days average traded volume. The companyâs stock beta was 0.57, reflecting lower volatility as compared to the benchmark index. The outstanding market capitalisation was around £783.34 million.
National Express Group Plc (LON:NEX)
United Kingdom-domiciled, National Express Group Plc is a Travel and Leisure company, its operating segments include UK Bus, UK Coach, German Rail, North America, Spain and Morocco. The shares of the National Express Group Plc got quoted on the main market of the LSE for trading on 26th April 1995.
NEX-Trading update from 1 July 2019 to 30 September 2019
The companyâs revenue was up by 14.5 per cent on a reported basis and was up by 11.8 per cent on a constant currency basis. The companyâs operating profit improved by 15 per cent on a constant currency, while it was up by 14.3 per cent on a reported basis. The companyâs operating margin also went up during the period.
NEX-Share price performance
On 18th December 2019, at the time of writing (before market close, GMT 1:28 PM), National Express Group Plc shares were trading at GBX 466.6, down by 0.51 per cent against its previous day closing price. Stock's 52 weeks High and Low is GBX 476.80 /GBX 356.00. At the time of writing, the share was trading 2.14% lower than its 52w High and 31.07% higher than its 52w low. Stockâs average traded volume for 5 days was 858,110.00; 30 days - 502,840.50 and 90 days - 459,994.30. The average traded volume for 5 days was up by 70.65% as compared to 30 days average traded volume. The companyâs stock beta was 0.64, reflecting lower volatility as compared to the benchmark index. The outstanding market capitalisation was around £2.44 billion.
Mitchells & Butlers PLC (LON:MAB)
Mitchells & Butlers PLC is a Birmingham, the United Kingdom-headquartered operator of managed restaurants and pubs which provides a wide choice of eating and drinking-out experiences through its well-known brands, including All Bar One, Toby Carvery, Harvester and Browns. The group is the leading restaurant and pub company in the UK as under a wide range of brands and formats, it has around 1,700 restaurants and pubs in the United Kingdom and Germany which seeks to deliver great service, quality and value for money to its guests.
MAB-Share price performance
On 18th December 2019, at the time of writing (before market close, GMT 1:30 PM), Mitchells & Butlers PLC shares were trading at GBX 440.0, down by 1.23 per cent against its previous day closing price. Stock's 52 weeks High and Low is GBX 483.00 /GBX 236.50. At the time of writing, the share was trading 8.90% lower than its 52w High and 86.05% higher than its 52w low. Stockâs average traded volume for 5 days was 476,946.40; 30 days - 422,891.20 and 90 days - 450,642.37. The average traded volume for 5 days was up by 12.78% as compared to 30 days average traded volume. The companyâs stock beta was 0.69, reflecting lower volatility as compared to the benchmark index. The outstanding market capitalisation was around £1.94 billion.
Safestay PLC (LON:SSTY)
United Kingdom-based, Safestay PLC is an owner and operator of a hostel company. The companyâs main activity consists of the operation of backpacker tourist hostels under the groupâs brand. The group provides accommodation for an array of guests, comprising from school groups, young adults and backpackers to families.
SSTY-Financial highlights for H1 FY19
The companyâs revenue rose by 24 per cent to £8.1 million in H1 FY19 in contrast to £6.5 million in H1 FY18. The companyâs Adjusted EBITDA (pre IFRS 16 adjustment) surged to £1.4 million in H1 FY19 as against £1.3 million in H1 FY18. As on 30th June 2019, the company had £8.3 million of cash in the bank.
SSTY- Share price performance
On 18th December 2019, at the time of writing (before market close, GMT 1:35 PM), Safestay PLC shares were trading at GBX 31.00, down by 1.59 per cent against its previous day closing price. Stock's 52 weeks High and Low is GBX 49.00 /GBX 29.00. At the time of writing, the share was trading 36.73% lower than its 52w High and 6.90% higher than its 52w low. Stockâs average traded volume for 5 days was 82,766.40; 30 days - 129,638.00 and 90 days - 105,664.34. The average traded volume for 5 days was down by 36.16% as compared to 30 days average traded volume. The companyâs stock beta was 1.12, reflecting higher volatility as compared to the benchmark index. The outstanding market capitalisation was around £22 million.
