


Lloyds Banking Group Plc
United Kingdom based, Lloyds Banking Group Plc (Identifier: LLOY) is engaged in the business of providing financial and banking services with an array of specialised services such as Investment Banking, Merchant Banking and Personal Banking. The company has segregated operations into Retail segment, Commercial Banking segment, Consumer Finance segment as well as Insurance and Other business segment.
LLOY-Q3 FY19 update
On 31st October 2019, the company released statement on the third quarter performance of the fiscal year 2019. The companyâs net income was down by 6 per cent to £4,187 million in Q3 FY19 as against £4,452 million in Q3 FY18. The companyâs underlying profit was down by 12 per cent to £1,822 million in Q3 FY19 as against £2,069 million in Q3 FY18.
LLOY-Financial highlights for H1 FY19
The company delivered a strong underlying profit of £4.19 billion in first half of the fiscal year 2019, which was comparable to that of the last year, with a profit after taxation (statutory) of £2.2 billion, which also factored in an extra payment protection insurance charge (PPI) of £650 million.
The banking net interest margin dipped by 3 basis points to 2.90%Â in first half of the financial year 2019 as compared to the first half of the financial year 2018. Â The Cost to income ratio of the company dipped by 1.8 percentage points to 45.9% in the first half of the financial year 2019 compared to the year-ago period.
The loan portfolio remained to be well-proportioned and credit quality remains solid, exhibiting prudent credit risk policy of the company. The companyâs interim ordinary dividend stood at 1.12 pence per share during H1 FY19, a surge of 5 per cent from that in the comparable period in FY18.
LLOY-Share price performance
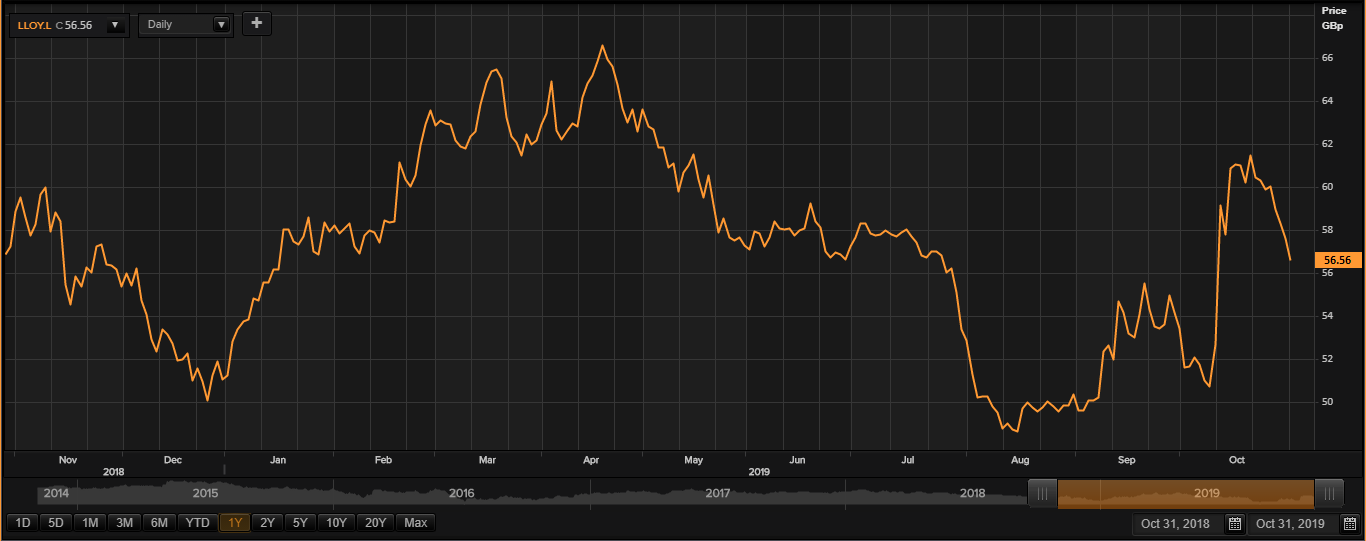
(Source: Thomson Reuters)
On 31st October 2019, while writing at 11:08 AM GMT, Lloyds Banking Group Plc shares were clocking a current market price of GBX 56.56 per share, down by 1.80 per cent in comparison to the last traded price of the previous day. The companyâs market capitalisation was at £40.34 billion at the time of writing.
On 23rd April 2019, the shares of LLOY have touched a new peak of GBX 67.90 and reached the lowest price level of GBX 48.16 on 15th August 2019 in the last 52 weeks. The companyâs shares were hovering at 16.70 per cent below from the 52-week high price mark and 17.44 per cent above from the 52-week low price mark at the current trading level as can be seen in the price chart.
At the time of writing before the market close, the stockâs traded volume was hovering around 65,406,144. The stock's 5-day average daily traded volume of the company was 148,701,004.40; 30 daysâ average daily traded volume- 183,992,522.47 and 90 daysâ average daily traded volume â 164,274,659.92. The volatility of the companyâs stock is lower as compared with the index taken as the benchmark, as the beta (5Y monthly) of the companyâs stock was recorded at 0.73.
In the last quarter, the shares of the company have delivered a positive return of 4.58 per cent. The companyâs stock surged by 11.09 per cent from start of the year to till date. The companyâs stock has given investors 1.37 per cent of positive return in the last year.Â
J Sainsbury PLC
J Sainsbury PLC (Identifier: SBRY) is a British chain of supermarkets, operating primarily in the United Kingdom. The company engages in grocery-related retailing and retail banking with interests in property as well. The company's brands include Sainsbury's groceries, Argos, Tu, Sainsbury's Home, Habitat and Sainsbury's Bank. The group's operations are differentiated into four operating segments: Retail â Food, General Merchandise and Clothing, Financial Services & Property Investment.
SBRY-Recent developments
Matt Brittin and Jean Tomlin, both the Non-Executive directors of the company have notified the board that they will step down from their positions next year. The effective dates for the same will be notified shortly. The company is looking forward to finding their replacements.
SBRY-Financial highlights for FY19
For the financial year ending 9th March 2019, due to an increase in the revenue from Retail and Financial Services businesses, the companyâs revenue increased slightly to £29,007 million as against £28,456 million in FY2018. The gross profit stood at £2,007 million in FY2019 versus £1,882 million in FY2018. Due to the higher administrative expenses for the period, the companyâs operating profit declined to £312 million in FY2019 from £518 million in FY2018.
The PBT (Profit before tax) stood at £239 million in FY2019 versus £409 million in FY2018. The companyâs PAT (Profit after tax) declined to £219 million in FY2019 from £309 million in FY2018.
The companyâs underlying basic earnings per share stood at 22 pence in FY2019 versus underlying basic earnings per share of 20.4 pence in FY2018. The basic EPS (reported) of the company stood at 9.1 pence per share in the fiscal year 2019 as against basic EPS (reported) of 13.3 pence per share in the fiscal year 2018.
The companyâs underlying diluted earnings per share stood at 20.3 pence in FY2019 versus underlying diluted earnings per share of 19.1 pence in FY2018. The companyâs reported diluted earnings per share stood at 8.9 pence in FY2019 versus reported diluted earnings per share of 12.7 pence in FY2018.
The companyâs top-line performance has improved in the first half of the financial year 2019. The profitability and the bottom-line performance have declined for the period.
The growing cost-cutting, along with simplification of the structure, has led to enhanced efficiencies. This, coupled with the company's focus on synergies from Argos, has resulted in a strong financial performance. Keeping up to date with the trend, the company is increasingly pushing into the online marketplace, which has been growing at an impressive pace. However, the acquisition of Asda is still under regulators' purview, and any adverse decision will affect the company's financials and future price. Moreover, the grocery, clothing and general merchandise markets remained in a very competitive and marketing-centred industry with strain on the margins. Fluctuations in the commodity and foreign currency rates can increase input costs which the group may not be able to pass on to the customers.Â
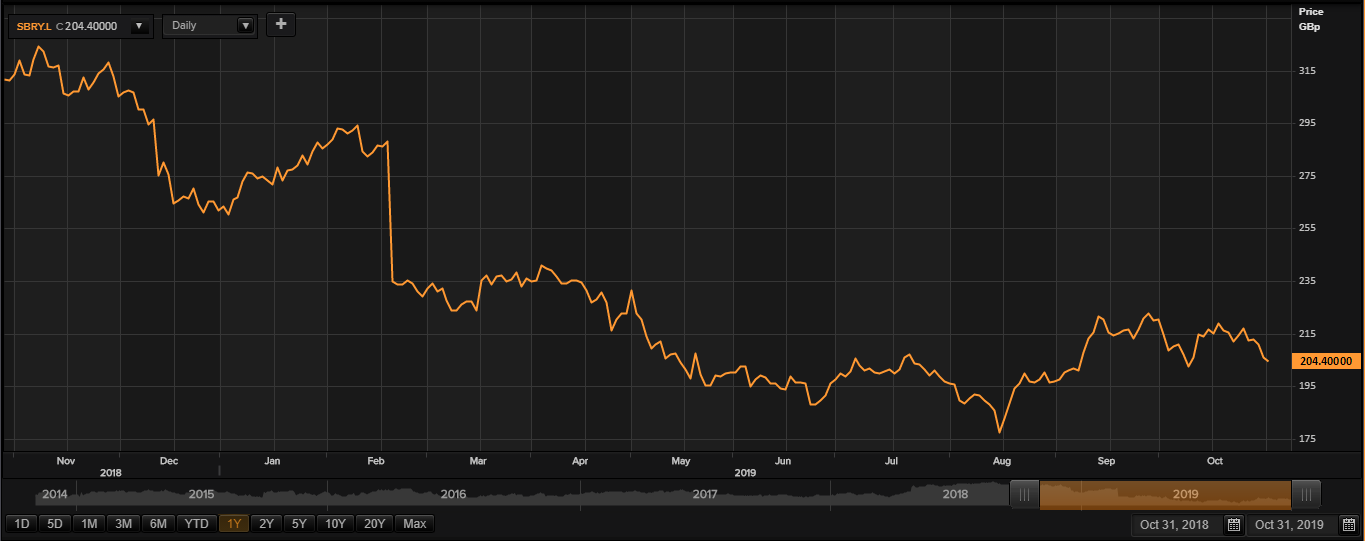
(Source: Thomson Reuters)
On 31st October 2019, while writing at 11:12 AM GMT, J Sainsbury PLC shares were clocking a current market price of GBX 204.40 per share, down 0.63 per cent in comparison to the last traded price of the previous day. The companyâs market capitalisation was at £4.55 Billion at the time of writing.
On 09th November 2018, the shares of SBRY have touched a new peak of GBX 327.25 and reached the lowest price level of GBX 177.05 on 15th August 2019 in the last 52 weeks. The companyâs shares were hovering at 37.54 per cent below from the 52-week high price mark and 15.44 per cent above from the 52-week low price mark at the current trading level as can be seen in the price chart.
At the time of writing before the market close, the stockâs traded volume was hovering around 1,475,700. The stock's 5-day average daily traded volume of the company was 5,680,067.60; 30 daysâ average daily traded volume- 6,282,286.30 and 90 daysâ average daily traded volume â 7,239,384.01. The volatility of the companyâs stock is almost similar as compared with the index taken as the benchmark, as the beta (5Y monthly) of the companyâs stock was recorded at 0.96.
In the last quarter, the shares of the company have delivered a positive return of 3.71 per cent. The companyâs stock plunged by 22.38 per cent from start of the year to till date. The companyâs stock has given investors 33.96 per cent of negative return in the last year.Â
