

Barratt Developments PLC
The United Kingdom-based Barratt Plc is a holding company engaged in the business of acquiring land, planning, designing, developing, constructing and selling the residential property and commercial property as well. The group's business operations are Housebuilding and Commercial developments. Around 99 per cent of the group's total revenue comes from housebuilding segment. Major brands of the company are Barratt Homes, David Wilson Homes and Barratt London.
Trading Statement (as on 10th July 2019)
Total homes completed including joint ventures increased to 17,856 homes for the year ended 30 June 2019 as compared with the financial year 2018 of 17,579 homes, with wholly owned completions increased by 2.6 per cent to 17,111 homes as compared with the financial year 2018 of 16,680 homes. Operating margin surged by 1.2 per cent to 18.9 per cent against the 17.7 per cent in FY18, with underlying margin increased by around 70 bps, primarily because of the margin initiatives of the company. The projected Profit before tax is likely to be ahead of market expectations at approximately £910 million as compared with the financial year 2018 of £835.5 million. For the 10th year in a row, the company received the HBFâs (Home Builders Federationâs) maximum 5 Star consumer satisfaction rating, due to the commitment to quality and consumer service. As on June-30-2019, the groupâs total forward sales (including JVs) reported a surge of 20 per cent at £2,604.1 million against the £2,175.7 million recorded in the year-ago period.
As at 30 June 2019, the companyâs net cash balance increased to £765 million as compared to £791.3 million on June 30, 2018, reflecting the overall solid trading, the timing of land acquisition and receipts related to joint ventures.
The company is further focussed for margin improvement and delivering a 3% to 5% volume growth over the medium term, land acquisition at a minimum 23% gross margin and expected to deliver a minimum of 25% Return on Capital Employed (ROCE). However, scheduled departure of Britain from the EU bloc has invoked the level of economic and political challenges in the near term.
Share Price Performance
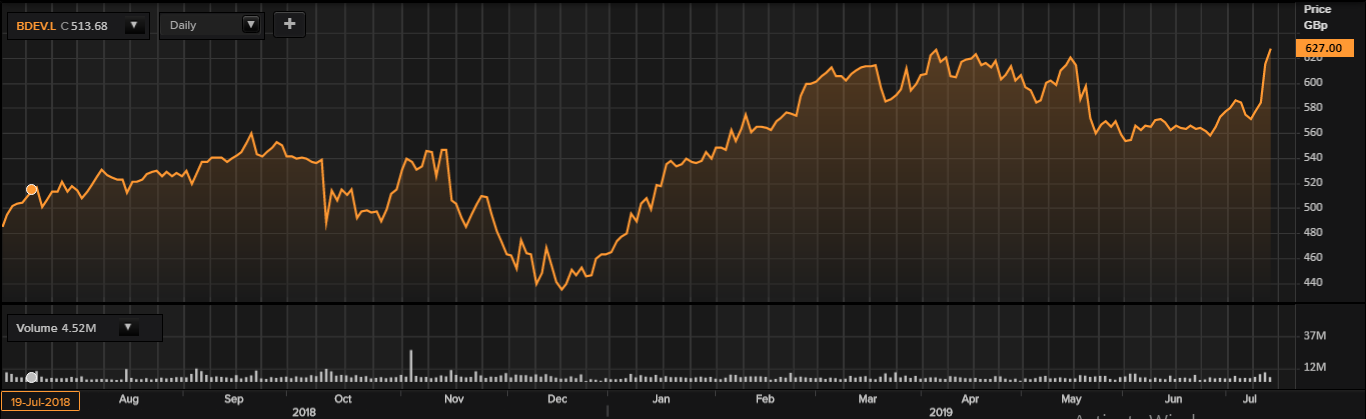
Daily Chart as at July-12-19, after the market closed (Source: Thomson Reuters)
On 12 July 2019, BDEV shares closed at GBX 627 and increased by 2.05% as compared with the previous day closing price. Stock's 52 weeks High is GBX 632.60 and 52-weeks Low is GBX 430. The groupâs stock beta stood at 0.73, reflecting lower volatility against the benchmark index. Total outstanding market capitalisation stood £6.35 billion, with a dividend yield of 4.39%.
PageGroup PLC
PageGroup PLC is an Addlestone, the United Kingdom-based company, which provides the recruitment consultancy and other ancillary services. The companyâs business is differentiated in four segments: EMEA, United Kingdom, Asia Pacific and Americas. The group focus around three brands operating at several levels of the market: Michael Page, Page Personnel and Page Executive. Michael Page recruits on a temporary, permanent, interim and contract basis. Page Executive provides executive search services. Page Personnel brand is engaged in specialist recruitment services to organizations requiring permanent or temporary employees or contract staff at administrative and technical support, professional clerical and junior management levels. The group's subsidiaries contain Page Personnel Argentina SA, Michael Page International Argentina SA, Michael Page International GmbH, and Michael Page International (Australia) Pty Limited. The company was earlier known as Michael Page International PLC.
Q2 FY19 and H1 FY19 Trading Update
In Q2 FY19, the reported gross profit increased by 7.9 per cent to £224.6 million as compared to £208.2 million in Q2 FY18, while on a constant currency basis, gross profit surged by 7.4 per cent. The five Large, high potential markets of South East Asia, Germany, Latin America, the United States and Greater China increased by 14 per cent. On a constant currency basis, gross profit from EMEA increased by 9 per cent, the Asia Pacific surged by 4.7 per cent, Americas rose by 17.4 per cent, while the UK declined by 2.4 per cent in Q2 FY19. In Q2 FY19, gross profit from Professional Services increased by 11.7 per cent at a constant currency. The company fee earner headcount declined by 122 in Q2 FY19. The net cash surged to £81 million as compared with the previous quarter.
In H1 FY19, reported gross profit rose by 9.5 per cent to £433.5 million against the £396 million in H1 FY18, while on a constant currency basis, gross profit surged by 9.5 per cent. On a constant currency basis, gross profit from EMEA increased by 10.2 per cent, the Asia Pacific surged by 9.1 per cent, Americas climbed by 19.4 per cent and the UK reduced by 0.3 per cent in H1 FY19.  In H1 FY19, gross profit from Professional Services increased by 13.7 per cent at constant currency.
The companyâs current macro-economic conditions are unfavourable due to the Brexit uncertainty. The groupâs projected operating profit for 2019 is near the lower end of the array of current market forecasts.
Share Price Performance
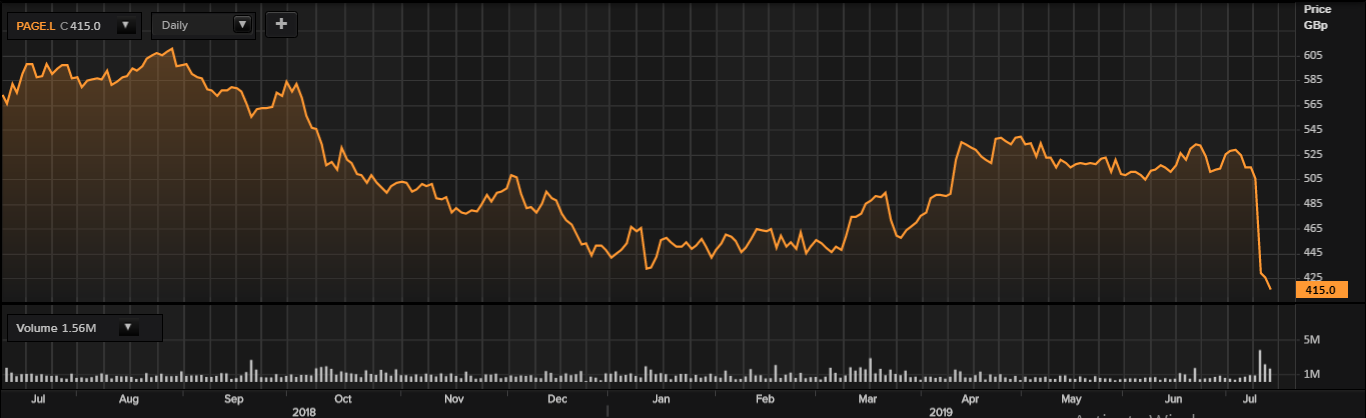
 Daily Chart as at July-12-19, after the market closed (Source: Thomson Reuters)
On 12 July 2019, PAGE shares closed at GBX 415 and decreased by 2.35% as compared with the previous day closing price. Stock's 52 weeks High is GBX 614.18 and 52-weeks Low is GBX 412.30. The groupâs stock beta stood at 0.72, reflecting lower volatility against the benchmark index. Total outstanding market capitalisation stood at around £1.36 billion with a dividend yield of 3.16%.
Superdry PLC
Superdry (SDRY) is an apparel brand with the main focus on providing good quality products. The companyâs products use British style with a mix of Americana and Japanese inspired graphics. The companyâs products are known for its quality fabrics, exclusive detailing, authentic vintage washes, hand-drawn graphics and custom fits for unique styling. The company had its operations in 46 countries and is operating 515 Superdry stores. It owns 139 stores within the UK and 168 stores outside the UK. The company also has franchised and licensed 208 stores and sell to more than 100 countries globally via Superdry.com.
Financial Highlights (FY2019, £ million)
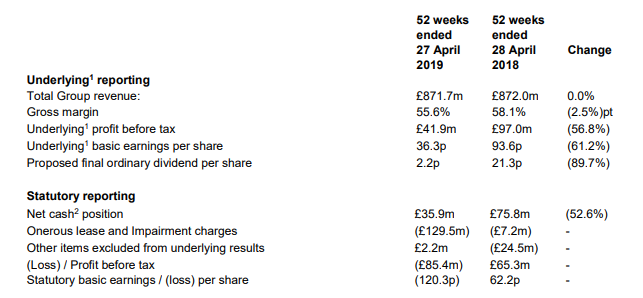
(Source: Preliminary Results, Company Website)
On an underlying basis, the companyâs reported total revenue slightly decreased to £871.7 million as compared with the previous year data, due to the modest growth attained in the Wholesale channel but a decline in the Retail channel. Gross margin decreased by 2.5 per cent to 55.6 per cent as compared with the financial year 2018 of 58.1 per cent. Profit before tax declined by 56.8 per cent to £41.9 million against the £97 million in FY18. Basic earning per share stood at 36.3 pence, a decrease of 61.2 per cent as compared with the financial year 2018 of 93.6 pence. The Board proposed a final ordinary dividend per share of 2.2 pence as compared with 21.3 pence in the financial year 2018.
On a statutory basis, net cash position decreased by 52.6 per cent to £35.9 million against the £75.8 million in FY18. Loss before tax was £85.4 million, a huge decline from the previous year profit before tax. Basic loss per share stood at 120.3 pence.
The uncertainty over the Brexit will impact the groupâs business performance. As the company operates worldwide, their financial performance can be dented with the fluctuations in the exchange rate and can also lead the company towards legal and regulatory risks. The company expect the financial performance in the financial year 2020 to reflect the historic issues inherited and market conditions.
Share Price Performance
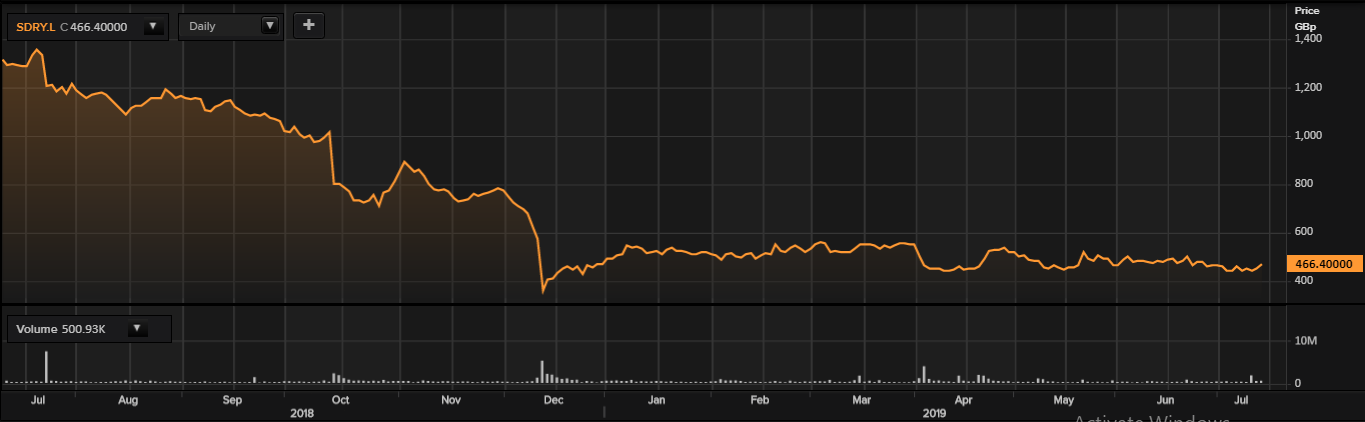
 Daily Chart as at July-12-19, after the market closed (Source: Thomson Reuters)
On 12 July 2019, SDRY shares closed at GBX 466.4 and increased by 3.83% as compared with the previous day closing price. Stock's 52 weeks High is GBX 1,364.13 and 52-weeks Low is GBX 354. The groupâs stock beta stood at 1.40, reflecting higher volatility against the benchmark index. Total outstanding market capitalisation stood at around £380.79 million with a dividend yield of 2.47%.
Yourgene Health PLC
Yourgene Health PLC (YGEN) is a Manchester, the United Kingdom-based company, which provides the molecular diagnostics business. The company offers the commercialization and development of gene analysis techniques for pre-natal screening and additional clinical applications in the initial detection, treatment and monitoring of disease.
Financial Highlights (FY2019, £)
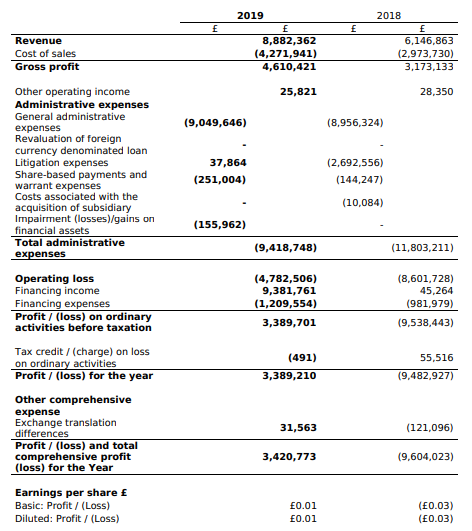
(Source: Final Results, Company Website)
For the year ended 31 March 2019, the reported revenue of the company increased by 45 per cent to £8.9 million as compared with £6.1 million of the financial year 2018. Gross profit surged by 45 per cent to £4.6 million against the £3.2 million in FY18. There was a decline of 29 per cent in adjusted EBITDA loss to £3.1 million, as compared to £4.4 million in FY18. Operating loss stood at £4.8 million, a 44 per cent decrease from the previous year data. For the year 2019, the total comprehensive profit was £3.4 million from the loss for the period 2018 of £9.6 million. Basic and diluted earnings per share stood at £0.01. Net cash excluding borrowings stood at £1 million as compared with the financial year 2018 net debt of £11.9 million. Its initial oncology product is in a soft launch phase with several European and UK clinical partners.
The group completed an equity fundraising in April 2019 with a gross proceed of £11.8 million and £8.8 million worth of EV (enterprise value) through the acquisition of Elucigene.
With the increasing international presence, de-risked business and the recently acquired Elucigene operations, the company is comfortably placed to realise its potential. The company now have an international genetics business that will continue to increase very rapidly in the coming years.
Share Price Performance
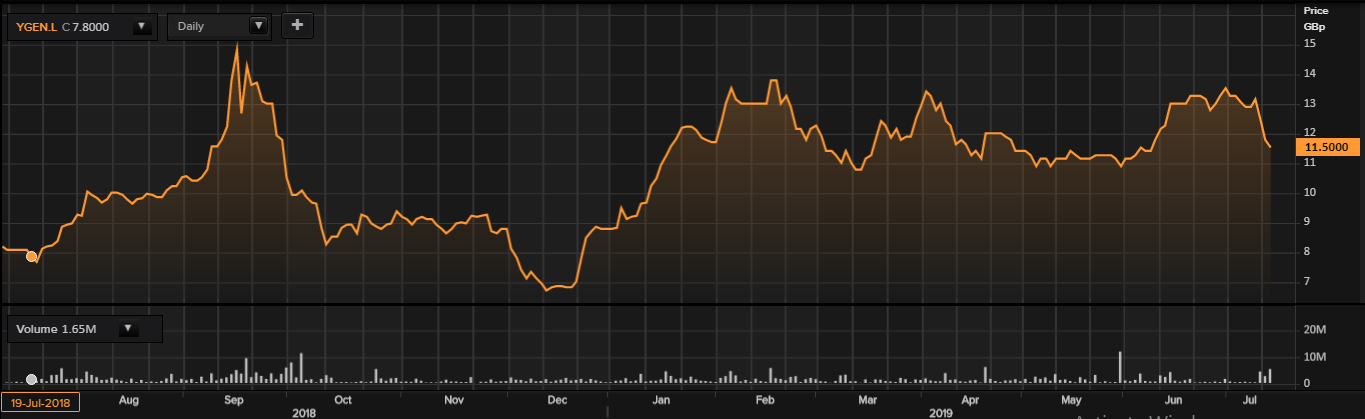
 Daily Chart as at July-12-19, after the market closed (Source: Thomson Reuters)
On 12 July 2019, YGEN shares closed at GBX 11.50 and decreased by 2.13 per cent as compared with the previous day closing price. Stock's 52 weeks High is GBX 16 and 52-weeks Low is GBX 6.42. The groupâs stock beta stood at 2.29, reflecting significantly higher volatility against the benchmark index. Total outstanding market capitalisation stood £68.59 million.
