


_05_16_2023_17_11_27_393572.jpg)


Dunelm Group PLC
Dunelm Group PLC (DNLM) is a UK based general retailer company and operates in the UK's homeware market. Dunelm and Dorma are the key brands of the company. The company has around 170 stores and a total headcount of around 10,000 workforces. The company offers products like furniture, curtains, blinds, bedding, rugs and decors through its platform and facilitates multichannel convenience through the online, mobile, catalogue, and telephone orders.
Trading Update
(Source: Company Filings)
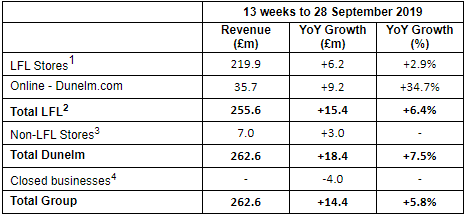
In the 13-week period ended 28 September 2019, due to continued market share gains and the weak comparative period last year, total Dunelm growth was 7.5% including the benefit of new stores, while like for like (LFL) sales increased by 6.4% in the first quarter. Reflecting the continuation of sourcing gains and lower levels of clearance stock compared to the prior year, gross margin improved by approximately 130bps in the first quarter. Weekly average net debt during the quarter was £5 million, and net debt as at 28 September 2019 was £24.0 million (FY 2019: £109.0 million).
Financial Highlights (FY 2019, in £m)
 (Source: Company Filings)
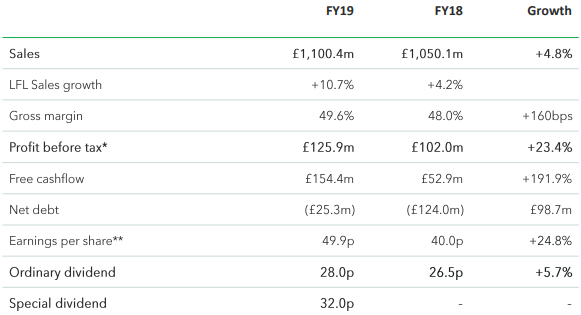
Driven by higher footfall in stores and traffic in online and reflecting strong growth in both LFL stores (7.7%) and dunelm.com (35.1%), revenue for the year increased by 4.8% to £1,100.4 million (FY 2018: £1,050.1 million), while total like for like revenue growth was 10.7%. Gross profit rose to $545.6 million from $503.6 million in FY 2018, and better sourcing decisions and improved cost price negotiation helped to post an improvement of 10bps in core Dunelm gross margin while gross margin increased by 160 basis points to 49.6% (FY 2018: 48.0%). Even as operating costs in FY19 increased in line with sales to £418.7 million, representing an operating cost to sales ratio of 38.0%, operating profit for the financial year was reported at £126.9 million (FY 2018: £104.7 million before exceptional costs), resulting in operating margin of 11.5% (FY 2018: 10.0%). Profit before tax was £125.9 million (FY 2018: £102.0 million before exceptional items), an increase of 23.4%. Profit after tax was £101.3 million (FY 2018: £73.3 million), and diluted earnings per share increased to 49.9p (FY 2018: 36.2p). Reflecting the lower number of new store openings during the year, gross capital expenditure in the financial year was £25.5 million compared with £44.0 million in FY 2018, while free cash flow was £154.4 million in the year (FY 2018: £52.9 million).
Share Price Commentary
On 10 October 2019, at the time of writing (before the market closed, GMT 2:51 pm), DNLM shares were trading at GBX 697.5, down by 14.41 per cent against the previous day closing price. Stock's 52 weeks High and Low are GBX 956.52/GBX 464.60. The company's stock beta was 0.78, reflecting less volatility as compared to the benchmark index. Total outstanding market capitalisation was around £1.65 billion, with a dividend yield of 3.44 per cent.
Outlook
The company reported that the FY 2019 final ordinary dividend and previously announced special dividend would be paid during the second quarter, while foreign exchange headwinds towards the end of the financial year will likely offset improvements made in gross margin in the first half. Customers behaviours and expectations have changed, and as consumer confidence remains low as the country enter Brexit, the UK retail sector continues to experience high levels of volatility and uncertainty. As the company experiences a reduction in traditional barriers to entry, many new retailers are entering the market, and the landscape is also rapidly changing. The company remains cautious on the outlook for FY 2020 because of pressures like increasing food inflation and political uncertainty.
XP Power Limited
XP Power Limited (XPP) is a Singapore-based manufacturer and developer of critical power control mechanisms for the electronics sector, which offers power solutions, including DC-DC converters and alternating current (AC)-direct current (DC) power supplies. The company's operations are differentiated into three geographical segments: Europe, North America and Asia. Currently, the group is a member of the FTSE All-Share and FTSE techMARK index.
Trading Update
For the 3rd quarter ended 30 September 2019, revenues rose by 2% to £53.8 million from £52.9 million in the prior year. However, 1% decline was recorded in the revenue in constant currency and like for like basis. Orders rose by 8% to £55.9 million, with a 4% increase in constant currency and 6% rise in like for like basis. Book to bill was reported at 1.04, against 0.98 in the prior year. Net debt at 30 September 2019 was £50.0 million compared to £50.4 million at 30 June 2019 and bringing the total dividend for the first three-quarters of 2019 to 55 pence per share, a dividend for the third quarter of 20 pence per share was announced.
Financial Highlights (H1 2019, in £m)
 (Source: Company Filings)
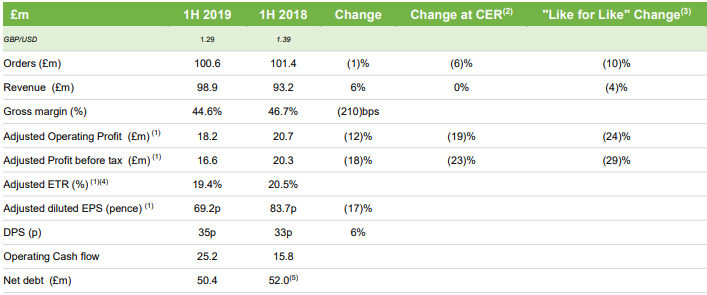
In H1 2019, revenue surged by 6% to £98.9 million as compared with the corresponding period of the last year. On a reported basis, Own-design XP product revenues surged by 6% to £77.3 million against the £72.6 million in H1 FY18 and represented 78% of total revenues. In the first half of 2019, adjusted profit before income tax was £16.6 million, a decrease of 18% from the previous year same period data, while reported profit before tax stood at £12.9 million. Reported profit attributable to equity holders reduced by 29% to £10.3 million as compared to £14.6 million in H1 FY18. Adjusted diluted earnings per share stood at 69.2 pence, a decrease of 17% from the same period in 2018. Reported diluted earnings per share was 52.8 pence in H1 FY19. For the first half of 2019, dividend per share surged by 6% to 35 pence against the 33 pence in H1 FY18, reflecting the confidence, the Board has in the company's longer-term prospects.
Share Price Commentary
On 10 October 2019, at the time of writing (before the market closed, GMT 2:54 pm), XPP shares were trading at GBX 2,420, up by 3.41 per cent against the previous day closing price. Stock's 52 weeks High and Low are GBX 2,740.00/GBX 1,855.00. The company's stock beta was 0.88, reflecting less volatility as compared to the benchmark index. Total outstanding market capitalisation was around £450.57 million, with a dividend yield of 3.72 per cent.
Outlook
While growth in the Industrial, Technology, and Healthcare markets remained healthy, this was offset by a cyclical slowdown in the Semiconductor Equipment Manufacturing market and pressure on the gross margins, resulting from the surge in the United States trade tariffs on Chinese manufactured goods, historic component product mix and price inflation. The group anticipate the combination of the current design wins & the cyclical recovery to produce significant progress in this sector. The company remain conscious of potential risks arising from the international macroeconomic challenges and continue to anticipate an improved revenue performance in the H2 FY19 as a result of the surge in the order book since the year-end.
N Brown Group PLC
N Brown Group PLC (BWNG) is a Manchester, the United Kingdom-headquartered digital fashion retailer, which focuses on catering underserved customer groups, specifically in size 20+ and age 50+. The group designs, sources and creates its product offerings by itself, and has an extensive range of products, predominantly homewares, footwear and clothing.
Financial Highlights (H1 2020, in £m)
 (Source: Company Filings)
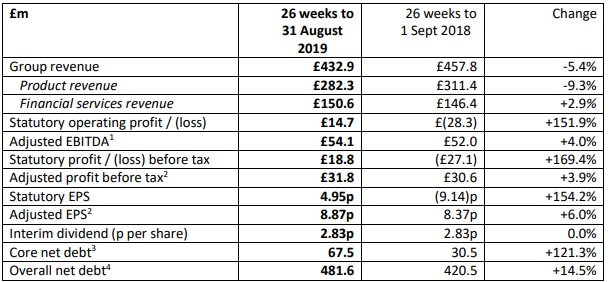
Due to the impact of the closure of the store portfolio in the prior year, the shift in focus away from the USA and the continued managed decline of the legacy offline business, product revenue declined by 9.3%, which led to a 5.4% fall in the group revenue to £432.9 million in H1 2020. As operating expenses before exceptionals decreased by 9.5%, statutory operating profit rose by 151.9% to £14.7 million, reflecting the exceptionals of £65.4 million recorded last year. Operating profit before exceptionals rose by 7% to £39.7 million, while adjusted EBITDA increased by 4.0% to £54.1 million. Adjusted profit before tax rose by 3.9% to £31.8 million from £30.6 million in the prior year, while statutory profit before tax was reported at £18.8 million. Statutory earnings per share were 4.95p (H1 2019: a loss of 9.14p), while adjusted EPS rose to 8.87p (H1 FY19 earnings per share: 8.37p).
Share Price Commentary
On 10 October 2019, at the time of writing (before the market closed, GMT 2:56 pm), BWNG shares were trading at GBX 107.7, up by 7.70 per cent against the previous day closing price. Stock's 52 weeks High and Low are GBX 153.00/GBX 81.65. The company's stock beta was 0.82, reflecting less volatility as compared to the benchmark index. Total outstanding market capitalisation was around £285.46 million, with a dividend yield of 7.10 per cent.
Guidance for FY 2020
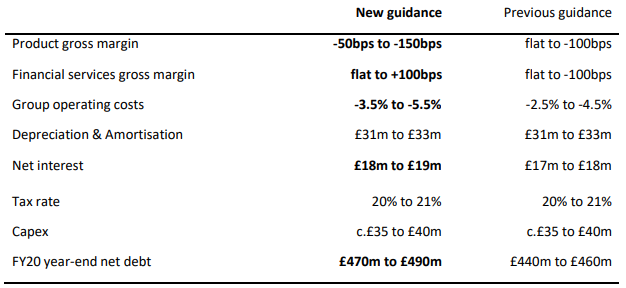
 (Source: Company Filings)
Outlook
The company focuses on bringing down net debt, invest in the business and deliver shareholder returns by generating sustainable free cash flow and deliver profitable digital growth. The company has aimed at maximising the UK core market before leveraging its international opportunity and has completely relaunched its social media strategy, with encouraging results in its initial days. To streamline the digital user experience, it seeks to deliver improvements to the customer experience, which would help in building a crisper, clearer brand proposition for its customers. Though the full-year expectations were unchanged, it remained mindful of significant uncertainties surrounding Brexit and continued challenging macroeconomic environment.
Comparative share price chart of Dunelm Group PLC, XP Power Limited and N Brown Group PLC
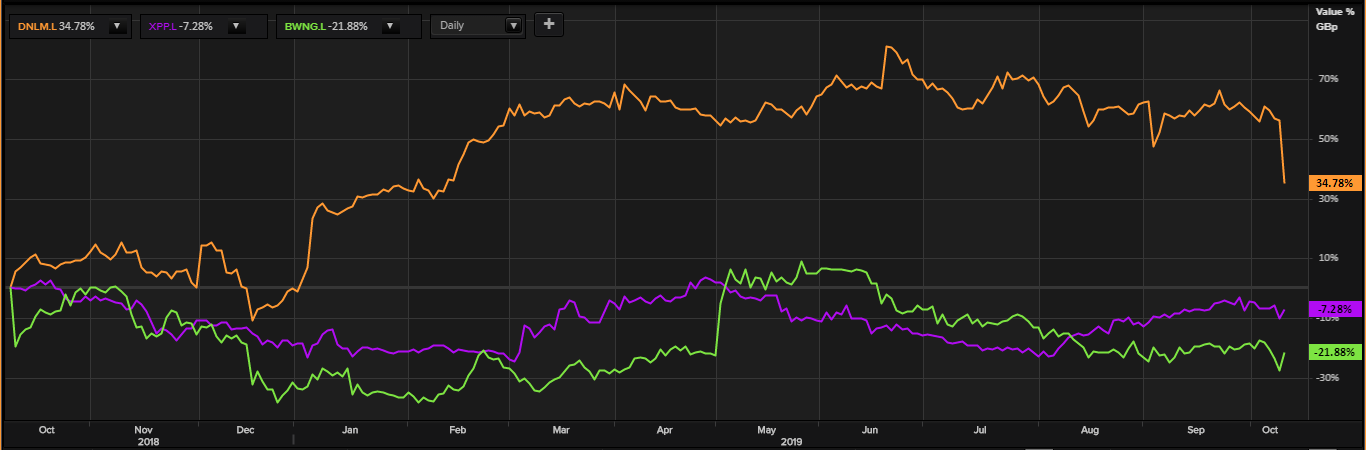
(Source: Thomson Reuters)
