


Connect Group
The United Kingdom-based Connect Group Plc (CNCT) is a distributor company. The company operates in magazine and newspaper wholesaling, and different freight distribution. The operations of the group are differentiated in three core operating segments, namely Smiths News, DMD and Tuffnells. The groupâs subsidiaries comprise Dawson Media Direct Ltd., Tuffnells Parcels Express Ltd., and Smiths News Holdings Ltd. The group is a member of the FTSE All-Share.
CNCT-Financial year for FY19
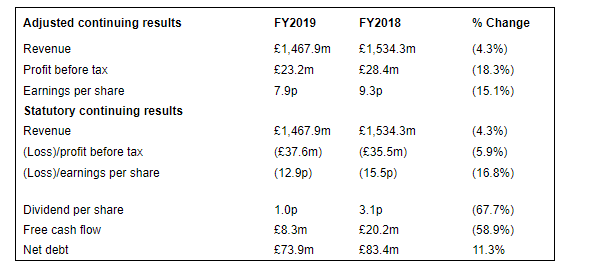
(Source: LSE)
On 6th November 2019, the company released audited results for the fiscal year 2019 period ended 31st August 2019. The companyâs revenue was down by 4.3 per cent to £1,467.9 million in FY19 as against £1,534.3 million in FY18. The companyâs profit before taxation was down by 18.3 per cent to £23.2 million in FY19 as against £28.4 million in FY18. The companyâs earnings per share were down by 15.1 per cent to 7.9 pence/share in FY19 as against 9.3 pence/share in FY18. The company generated free cash flow from continuing operations of £8.3 million in FY19 as against £20.2 million in FY18. This helped the company in reducing its Net debt by 11.3 per cent to £83.4 million in FY19 from £73.9 million in FY18. The company has recommended a full and final dividend for the fiscal year 2019 of 1 pence per share, which was down by 2.1 pence per share compared to the annual dividend of Financial Year 2018.
 CNCT-Share price performance
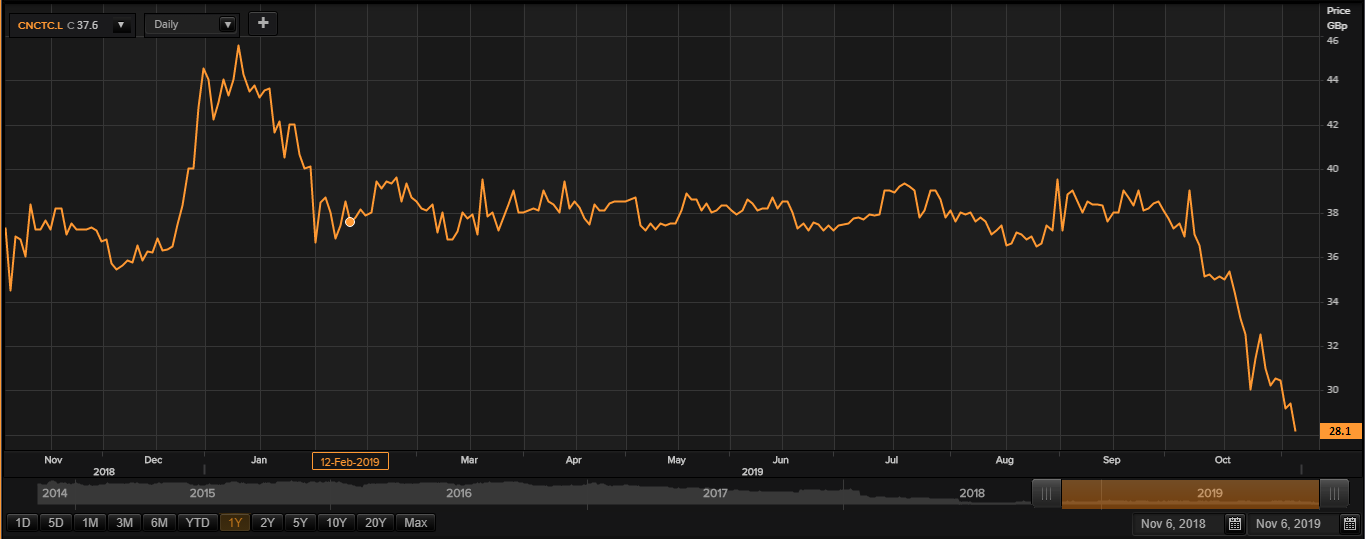
(Source: Thomson Reuters)
While writing (as on 06th November 2019, at 11:24 AM GMT), Connect Group PLC shares were trading at GBX 28.10 per share; plunged by 4.42 per cent as compared to the previous day closing price level. The companyâs market capitalisation was around £72.81 million.
CNCT shares have clocked a high of GBX 46.39 (as on 11 January 2019) and a low of GBX 27.50 (as on 06 November 2019) in the past year. At the current price point, as quoted in the price chart, the companyâs shares were trading 39.42 per cent below the 52-week high price point and 2.18 per cent above the 52-week low price point.
At the time of writing, the stockâs volume before the market close, stood at 1,322,581. Stock's average daily traded volume for 5 days was 268,588.60; 30 days- 254,222.80 and 90 days â 247,695.59. The companyâs stock beta (5Y monthly) was 0.75, which makes it less volatile as against the benchmark index.
The average daily traded volume for 5 days surged by 5.65 per cent as against 30 days average daily traded volume. At the time of writing, the shares of the company were trading below the 30-days and 60-days SMA.
In the past 1 month, CNCT shares have delivered a negative return of 21.60 per cent. Also, on a YTD (Year-to-Date) time interval, the stock plunged by approximately 31.23 per cent and was down by 22.63 per cent in the last three months.
Share's RSI (Relative Strength Index) for the 30-days, 14-days and 9-days was recorded at 34.50, 30.17 and 28.66 respectively. Also, the stockâs 3-days RSI was recorded at 27.39.
Â
Marks and Spencer Group Plc
Marks and Spencer Group Plc (MKS) incorporated in the year 1884 with headquarters in London, the United Kingdom, is a well-known supplier of clothing, footwear, home furnishings, beauty care, accessories and food products through a network of retail stores and online channels. The company trades at the London Stock Exchange and is a part of the FTSE 100 index. The companyâs business operations are spread across over 50 countries, having a customer base of around 30 million-plus users and established stores nearing 1,500.
MKS-Financial highlights for H1 FY20
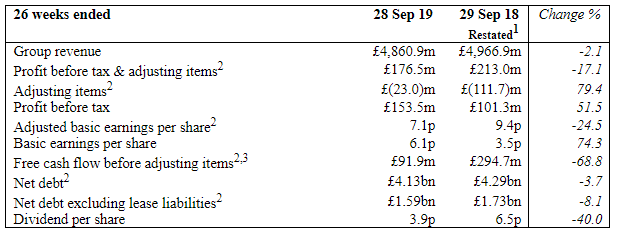
(Source: LSE)
On 6th November 2019, the company released interim results (audited) for the fiscal year period ended 28th September 2019. The companyâs revenue plunged 2.1% to £4,860.9 million from £4,966.9 million in a year-ago period. Pre-tax profit, including adjusting items slumped 17.1% to £176.5 million from £213 million reported in the comparable period of the previous financial year. However, excluding adjusted items, pre-tax profit climbed 51.5% to £153.5 million from £101.3 million in H1FY19. Adjusted basic earnings per share declined 24.5% to 7.1 pence from 9.4 pence in H1FY19, and Basic earnings per share surged 74.3% to 6.1 pence on a YoY basis. However, the group's free cash flow before adjusting items plunged approximately 68.8% to £91.9 million from £294.7 million reported in the year-over period. Also, the interim dividend per share slumped 40% on a YoY basis to 3.9 pence from 6.5 pence declared in the H1 FY19.
The company's performance in the H1 FY20 was relatively lower against the year-over period, while Free cash flow (excluding adjusting items) dipped by 68.8% from the previous corresponding financial year.
 MKS-Share price performance
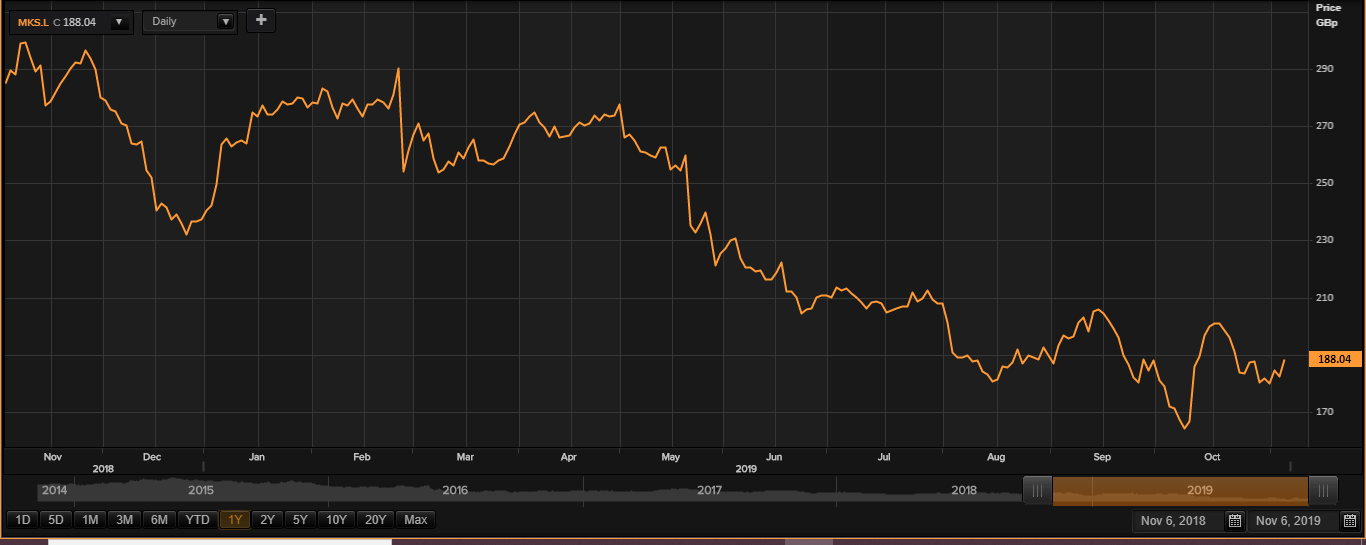
(Source: Thomson Reuters)
While writing (as on 06th November 2019, at 12:33 PM GMT), Marks and Spencer Group PLC shares were trading at GBX 188.04 per share; surged by 3.12 per cent as compared to the previous day closing price level. The companyâs market capitalisation was around £3.56 billion.
MKS shares have clocked a high of GBX 301.27 (as on 07 November 2018) and a low of GBX 161.35 (as on 10 October 2019) in the past year. At the current price point, as quoted in the price chart, the companyâs shares were trading 37.58 per cent below the 52-week high price point and 16.54 per cent above the 52-week low price point.
At the time of writing, the stockâs volume before the market close, stood at 6,741,860. Stock's average daily traded volume for 5 days was 6,747,531.80; 30 days- 9,286,175.67 and 90 days â 8,549,238.07. The companyâs stock beta (5Y monthly) was 1.02, which makes it more volatile as against the benchmark index.
The average daily traded volume for 5 days plunged by 27.34 per cent as against 30 days average daily traded volume. At the time of writing, the shares of the company were trading below the 30-days and 60-days SMA.
In the past 1 month, MKS shares have delivered a positive return of 6.11 per cent. Also, on a YTD (Year-to-Date) time interval, the stock plunged by approximately 22.87 per cent and was down by 4.35 per cent in the last three months.
Share's RSI (Relative Strength Index) for the 30-days, 14-days and 9-days was recorded at 45.51, 45.59 and 44.19 respectively. Also, the stockâs 3-days RSI was recorded at 45.08.
Â
