


Vivo Energy Plc
Vivo Energy PLC (Identifier: VVO) is engaged in the business of Oil refining and marketing under the brands âShellâ and âEngenâ to retail and commercial customers in Africa. The company distributes fuels, lubricants and liquefied petroleum gas (LPG).
VVO-Q3 FY19 Trading update
On 25th October 2019, the company released trading update for third quarter for the fiscal year 2019.The companyâs Q3 sales volume surged by 15 per cent, driven by Engen-branded markets on YoY basis. The companyâs Q3 gross cash profit surged by 13 per cent to $189 million on YoY basis, driven by stable margins and higher volumes. The companyâs Q3 Gross cash unit margin stood at $71 per thousand litres as against $72 per thousand litres in Q3 FY18.
VVO-Financial highlights for H1 FY19
In the first half of the financial year 2019, due to good contribution from Engen, the companyâs revenue increased by 6 per cent to US$3,903 million as against US$3,673 million in H1 FY2018. The companyâs adjusted EBITDA was up by 4 per cent to US$212 million in H1 FY2019 versus a US$204 million in H1 FY2018. The companyâs EBITDA was up by 13 per cent to US$200 million in H1 FY2019 versus US$176 million in H1 FY2018. The companyâs reported PAT (Profit after tax) stood at US$72 million for the first half of the financial year 2019 versus PAT (Profit after tax) of US$71 million in the H1 of the financial year 2018. The reported diluted earnings per share in H1 FY2019 declined by 6 per cent to 5.1 US cents from 5.4 US cents in H1 FY2018.
The company has shown decent financial performance in the first half of the financial year 2019. Both the top-line and the bottom-line performance have improved for the period. The recent acquisition of Engen Holdings is also performing well and contributing well to the companyâs revenue growth for the period. The business was able to grow its EBITDA in full year FY18, and this highlights the flexibility and diversification of the company's portfolio. The company had opened 41 service stations across its markets for the period.Â
Â
VVO-Share price performance
 Source: Thomson Reuters
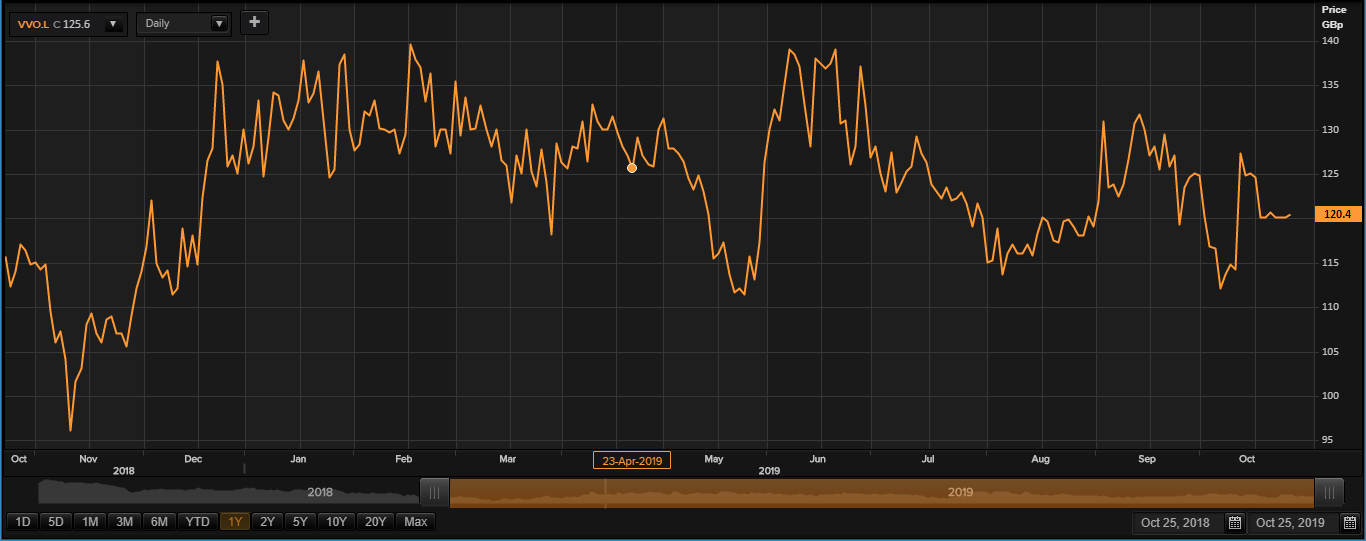
On 25th October 2019, while writing at 11:09 AM GMT, Vivo Energy PLC shares were clocking a current market price of GBX 120.40 per share, up by 0.33 per cent in comparison to the last traded price of the previous day. The companyâs market capitalisation was at £1.53 billion at the time of writing.
On 17th June 2019, the shares of VVO have touched a new peak of GBX 144.70 and reached the lowest price level of GBX 93.71 on 12th November 2018 in the last 52 weeks. The companyâs shares were trading at 16.79 per cent lower from the 52-week high price mark and 28.48 per cent higher the 52-week low price mark at the current trading level as can be seen in the price chart.
The stockâs traded volume was hovering around 99,033 at the time of writing before the market close. The companyâs 5-day average daily traded volume was 1,015,796.20; 30 daysâ average daily traded volume- 493,031.03 and 90 daysâ average daily traded volume â 326,311.10. The volatility of the companyâs stock was lower as compared with the index taken as the benchmark, as the beta (2Y weekly) of the companyâs stock was recorded at 0.54.
The shares of the company have delivered a negative return of 1.80 per cent in the last quarter. The companyâs stock plunged by 4 per cent from start of the year to till date. The companyâs stock has given investors 3.72 per cent of positive return in the last year.Â
Synthomer PLC
Synthomer Plc (Identifier: SYNT) is one of the worldâs leading suppliers of polymers. The company helps its clients from multiple industries, which include paper, construction, textiles, synthetic latex gloves and coatings, to develop new products and improve performance for the existing products. The company operates globally with Europe, Asia, the Middle East and North America being the key markets.
SYNT-Q3 FY19 Trading update
On 25th October 2019, the company released trading update for third quarter for the fiscal year 2019. The company remained levered with net debt/ EBITDA of 1.4x, which remained flat in comparison to the position as on 30 September last year. The company continues to reap benefits from its strong product portfolio.
SYNT-Financial highlights for H1 FY19
For the first half of the financial year 2019, the companyâs revenue declined by 8.5 per cent to £762.7 million as against £833.8 million in the H1 FY2018. The decrease in the revenue was driven by weakness in the Functional Solutions and European SBR Latex businesses for the period. The slower start in Europe also resulted in revenue decline. The companyâs volume declined by 5.7 per cent to 750.8 ktes in H1 FY2019 from 796.6 ktes in the H1 FY2018.
The underlying operating profit declined by 5.9 per cent to £74.7 million in H1 FY2019 from £79.4 million in the H1 FY2018 period. The underlying PBT (Profit before Tax) declined by 7.9 per cent to £70.2 million in H1 FY2019 from £76.2 million in the H1 FY2018. The IFRS PBT (Profit before Tax) declined to £56.6 million in H1 FY2019 from £86.2 million in the H1 FY2018. The companyâs underlying earnings per share stood at 16.5 pence in H1 FY2019 versus 17.1 pence in H1 FY2018 and declined by 3.5 per cent. The companyâs IFRS earnings per share stood at 13 pence in H1 FY2019 versus 19.20 pence in H1 FY2018. The companyâs dividend per share was up by 8.1 per cent to 4 pence in H1 FY2019 from 3.7 pence in H1 FY2018.
The companyâs financial performance in the first half of the financial year 2019 had declined. There had been a decline in both top-line and bottom-line performance for the current period. The companyâs SBR Latex business in the European market remained challenging and is expected to remain challenging in the second half as well.
The companyâs new products had a sales volume of 21 per cent and increased as compared to 20 per cent in the corresponding period of the last year and were driven by strong research and development. The companyâs management remained confident about the progress in the second half of the financial year 2019. The improved market conditions and increased capacity are benefiting the company to enhance its operational and financial performance.
The companyâs Nitriles business is continuously delivering a strong performance, which offset the poor performance of SBR Latex business in the European market. The company is targeting other markets through capital investment and strategic acquisitions.
Â
SYNT-Share price performance
 Source: Thomson Reuters
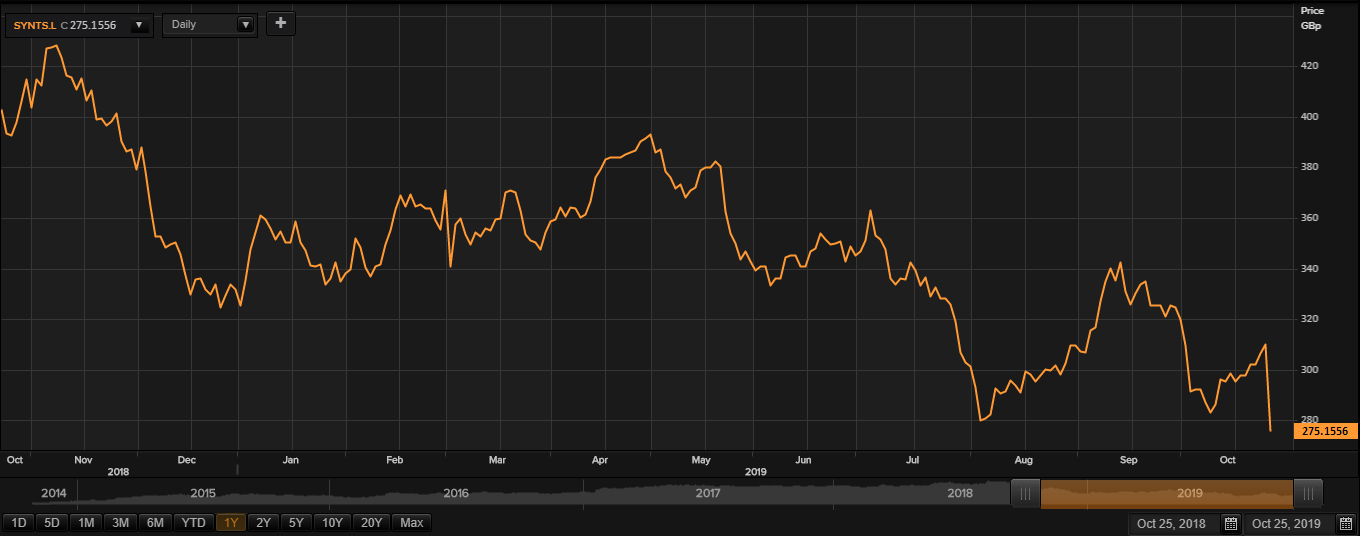
On 25th October 2019, while writing at 11:15 AM GMT, Synthomer Plc shares were clocking a current market price of GBX 275.15 per share, down by 11.12 per cent in comparison to the last traded price of the previous day. The companyâs market capitalisation was at £1.32 billion at the time of writing.
On 06th November 2018, the shares of SYNT have touched a new peak of GBX 430.52 and reached the lowest price level of GBX 264.40 on 25th October 2019 in the last 52 weeks. The companyâs shares were trading at 36.08 per cent lower from the 52-week high price mark and 4.06 per cent higher than the 52-week low price mark at the current trading level as can be seen in the price chart.
The stockâs traded volume was hovering around 2,539,469 at the time of writing before the market close. The companyâs 5-day average daily traded volume was 672,006.80; 30 daysâ average traded volume- 992,350.40 and 90 daysâ average traded volume â 1,098,702.31. The volatility of the companyâs stock is almost comparable to the index taken as the benchmark, as the beta (5Y monthly) of the companyâs stock was recorded at 0.93.
The shares of the company have delivered a negative return of 5.61 per cent in the last quarter. The companyâs stock plunged by 7.20 per cent from start of the year to till date. The companyâs stock has given investors 23.12 per cent of negative return in the last year.Â
