


About Petra Diamonds Ltd
United Kingdom-based Petra Diamonds Ltd (PDL) is a leading independent diamond mining group. The group specialises in the exploration, mining and sale of rough diamonds, and has one of the world's largest diamond resources. The company primarily operates in the Southern Africa with operations in Tanzania, South Africa and Botswana. It has interests in five producing operations including one open pit mine in Tanzania and four underground mines in South Africa. Major segments are Mining and Exploration.
PDL-Financial Highlights for FY19
On 16th September 2019, the company announced its unaudited results for the year ended 30th June 2019. The companyâs production capacity clocked 3.87 Mcts, which was in line with management expectations in FY19. The company is now well poised to achieve a target of 3.8 Mcts in FY2020. The companyâs revenue plunged by 6 per cent to US$463.6 million in FY19 as against US$495.3 million in FY18. This can be attributed to lesser sales of carats during the year, down by 1.5 per cent to 3,736,847 carats as against 3,793,799 carats in FY18 coupled with weaker demand in the diamond market and product mix. Due to the market scenario, the company saw a plunge of 5 per cent in the diamond prices. The companyâs profit reaped out of mining activities was down by 21.4 per cent to US$161.1 million in FY19 as against US$205.1 million in FY18. This downside in profit can be attributed to lower sales and surge in mining and processing costs.
The companyâs EBITDA (adjusted) plunged by 21.6 per cent to US$153.0 million in FY19 as against US$195.4 million in FY18. The companyâs adjusted EBITDA margin plunged to 33 per cent due to lower diamond prices in FY19 as against 39.4 per cent in FY18. The companyâs net loss post taxation was recorded at US$258.1 million in FY19 as against net loss of US$203.1 million in FY18. The company managed to generate positive operational free cash flow of US$70.5 million in FY19 due to companyâs capital investment and stability in operations for facilitating productions. This was a significant highlight during the year for the company.  The companyâs On-mine cash costs were in accordance with the management expectations, the company strives for cost optimisations and protect margins. The company recorded lower Capex (operational) this year of US$81.4 million which excludes capitalised costs of borrowing, the corresponding capex in FY18 was recorded at US$129.6 million. The companyâs basic loss per share (continuing operations) stood at 20.18 cents in FY19 as against a loss of 15.85 cents in FY18. The companyâs cash at bank stood at US$85.2 million at 30th June 2019 as against US$236.0 million at 30th June 2018. The companyâs account receivables (diamond) stood at US$23.8 million at 30th June 2019 as against US$75.0 million at 30th June 2018.
The companyâs loans and borrowings (under IFRS adoption) stood at US$650.6 million at 30th June 2019 as against US$754.8 million at 30th June 2018. In FY19, the company managed to settle the loans (along with interest) with the lenders by paying US$106.7 million. The companyâs net debt (post adjusting for diamond receivables) stood at US$541.0 million at 30th June 2019 as against US$445.7 million at 30th June 2018. The companyâs total production for July and August 2019 stood at 705 Kcts. The company aims to improve operational cost efficiencies.
Petra Diamonds is a leading independent diamond mining group company with substantial diamond reserves. Strong project portfolio enables the company to enhance its business growth objectives. Though the news of the appointment of the CEO (Richard Duffy) is a positive development, given his impressive experience in mining, Africa and finance, the continued rise in net debt despite decreased capital expenditure is still a matter of concern. Recent weakness in the diamond market has hit the company's financials.
In Project 2022, the company will drive efficiencies and identify and improvements over all aspects of the business to enable the group to deliver an early target in the range of $150-200 million cumulative free cash flow across a three-year period. This 2022 project will focus on reducing net debt and enhancing cash flow generation to offer optionality to address the refinancing of the bond. The group is not looking to raise equity to refinance the bond.
Production guidance for the full year 2020 has been maintained and remains flat at 3.8 million carats from the financial year 2019, while tailings production will decline to 0.05 million carats in FY2020.
PDL-Share price performance
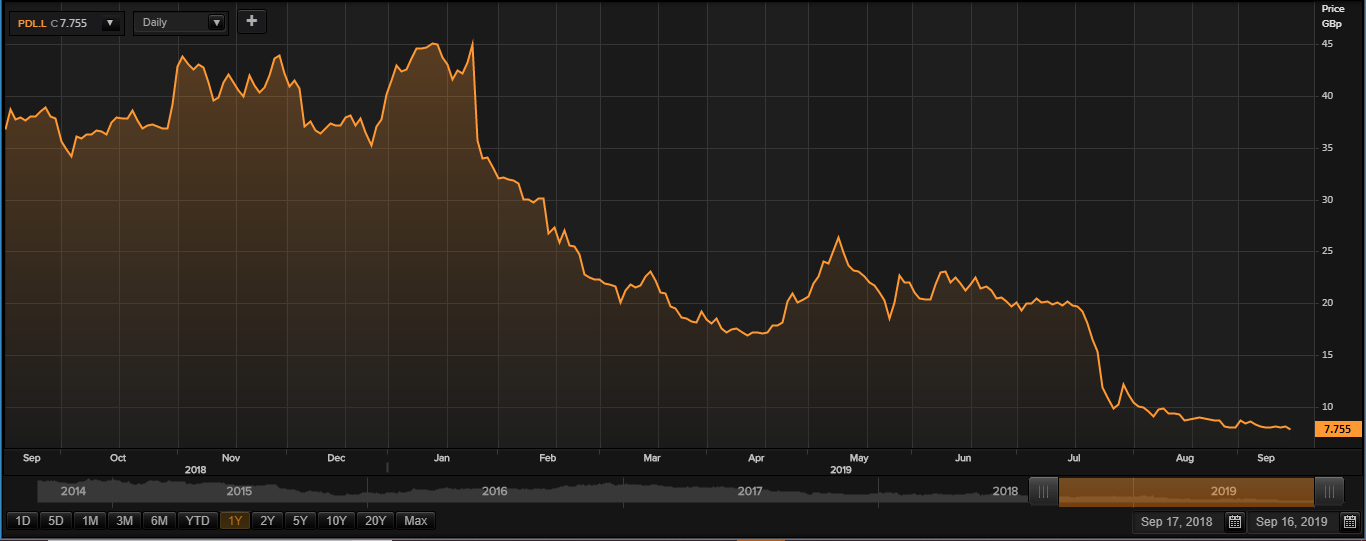
Daily Chart as at 16-September-19, before the market closed (Source: Thomson Reuters)
On 16th September 2019, while writing at 12:21 PM GMT, Petra Diamonds Ltd shares were clocking a current market price of GBX 7.75 per share; which was less by 3.72 per cent in comparison to the last traded price of the previous day. The companyâs market capitalisation was at £69.66 million at the time of writing.
On 14th January 2019, the shares of PDL have touched a new peak of GBX 46.42 and reached the lowest price level of GBX 7.25 on today i.e. 16th September 2019 in the last 52 weeks. The companyâs shares were trading at 83.30 per cent lower from the 52-week high price mark and 6.89 per cent higher the 52-week low price mark at the current trading level as can be seen in the price chart.
The stockâs traded volume was hovering around 23,965,841 at the time of writing before the market close. The companyâs 5-day stock's average traded volume was 6,581,969.20; 30 days average traded volume- 6,598,232.17 and 90 days average traded volume â 6,182,707.81. The volatility of the companyâs stock is lower as compared with the index taken as the benchmark, as the beta of the companyâs stock was recorded at 0.79.
The shares of the company have delivered a negative return of 64.09 per cent in the last quarter. The companyâs stock plunged by 78.64 per cent from start of the year to till date. The companyâs stock has given investors 77.51 per cent of negative return in the last year.Â
About Spire Healthcare Group PLC (SPI)
Spire Healthcare Group PLC (SPI) is a hospital group based out of United Kingdom. In terms of revenue, it is the largest independent hospital group in the country. The company is the principal independent provider by volume of knee and hip operations in the United Kingdom, and offers diagnostics, in-patient, day case and out-patient care in a wide range of areas. Though significant capital investments in its estate, the company has grown considerably since it was founded with the acquisition of 25 Bupa hospitals in 2007. The stock is a part of the FTSE250 index. The companyâs revenue is differentiated based on wider customer group, which are Insured, NHS, Self-pay, Partnerships and Other.
SPI-Financial highlights for H1 FY19
On 16th September 2019, the company declared results for the first half of 2019. The companyâs revenue surged by 3.36 per cent to £491.6 million in H1 FY19 post IFRS 16 adjustment as against £475.6 million in H1 FY18. The companyâs profit post taxation was recorded at £7.1 million for H1 FY19 as against £2.1 million in H1 FY18. The companyâs gross margin stood at 46.88 per cent in H1 FY19 and almost remained flat in comparison to same period in previous year. The companyâs cost of sales surged by 3.77 per cent to £261.1 million in H1 FY19 as against £251.6 million in H1 FY18. The companyâs operating margin (excluding exceptional and other items) was down to 10.45 per cent in H1 FY19 from 11 per cent in H1 FY18. The management has announced a semi-annual dividend (2019) of 1.3 pence per share which would be payable on 10th December 2019.
Â
SPI-Share price performance
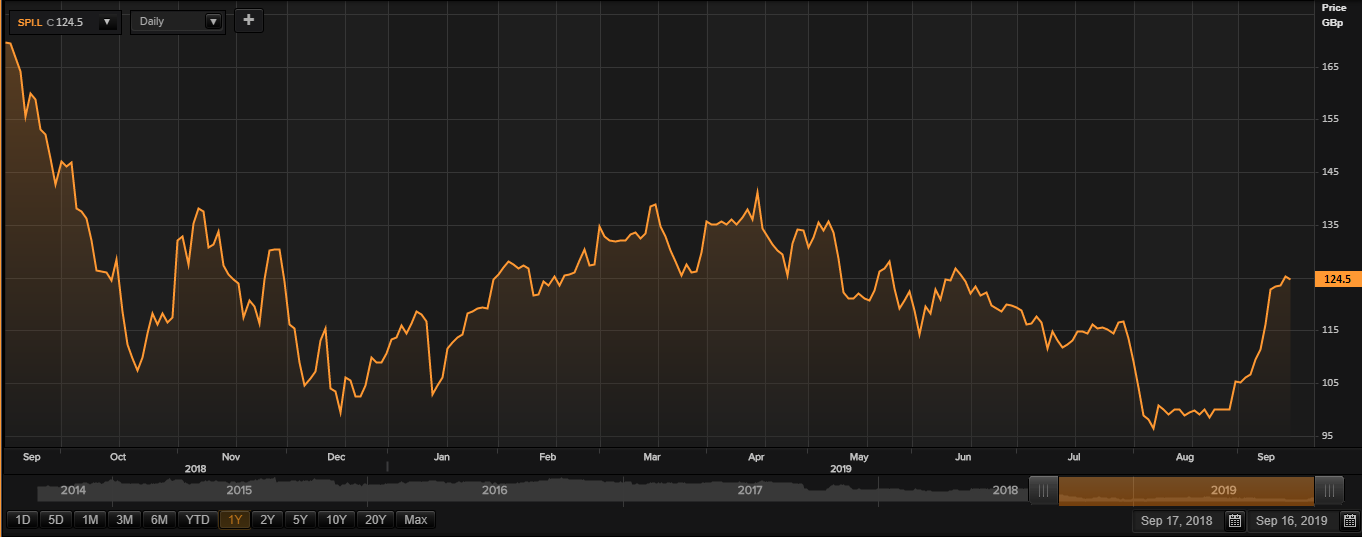
Daily Chart as at 16-September-19, before the market closed (Source: Thomson Reuters)
On 16th September 2019, while writing at 12:15 PM GMT, Spire Healthcare Group PLC shares were clocking a current market price of GBX 124.5 per share; which was down by 0.47 per cent in comparison to the last traded price of the previous day. The companyâs market capitalisation was at £501.75 million at the time of writing.
On 17th September 2018, the shares of SPI have touched a new peak of GBX 176 and reached the lowest price level of GBX 95.25 on 8th August 2019 in the last 52 weeks. The companyâs shares were trading at 29.26 per cent lower from the 52-week high price mark and 30.70 per cent higher the 52-week low price mark at the current trading level as can be seen in the price chart.
The stockâs traded volume was hovering around 1,433,998 at the time of writing before the market close. The companyâs 5-day stock's average traded volume was 1,359,894.60; 30 days average traded volume- 860,597.23 and 90 days average traded volume â 557,021.32. The volatility of the companyâs stock is higher as compared with the index taken as the benchmark, as the beta of the companyâs stock was recorded at 1.45.
The shares of the company have delivered a negative return of 1.18 per cent in the last quarter. The companyâs stock surged by 14.88 per cent from start of the year to till date. The companyâs stock has given investors 26.46 per cent of negative return in the last year.Â
